Copyright
©The Author(s) 2024.
World J Clin Cases. Oct 26, 2024; 12(30): 6374-6382
Published online Oct 26, 2024. doi: 10.12998/wjcc.v12.i30.6374
Published online Oct 26, 2024. doi: 10.12998/wjcc.v12.i30.6374
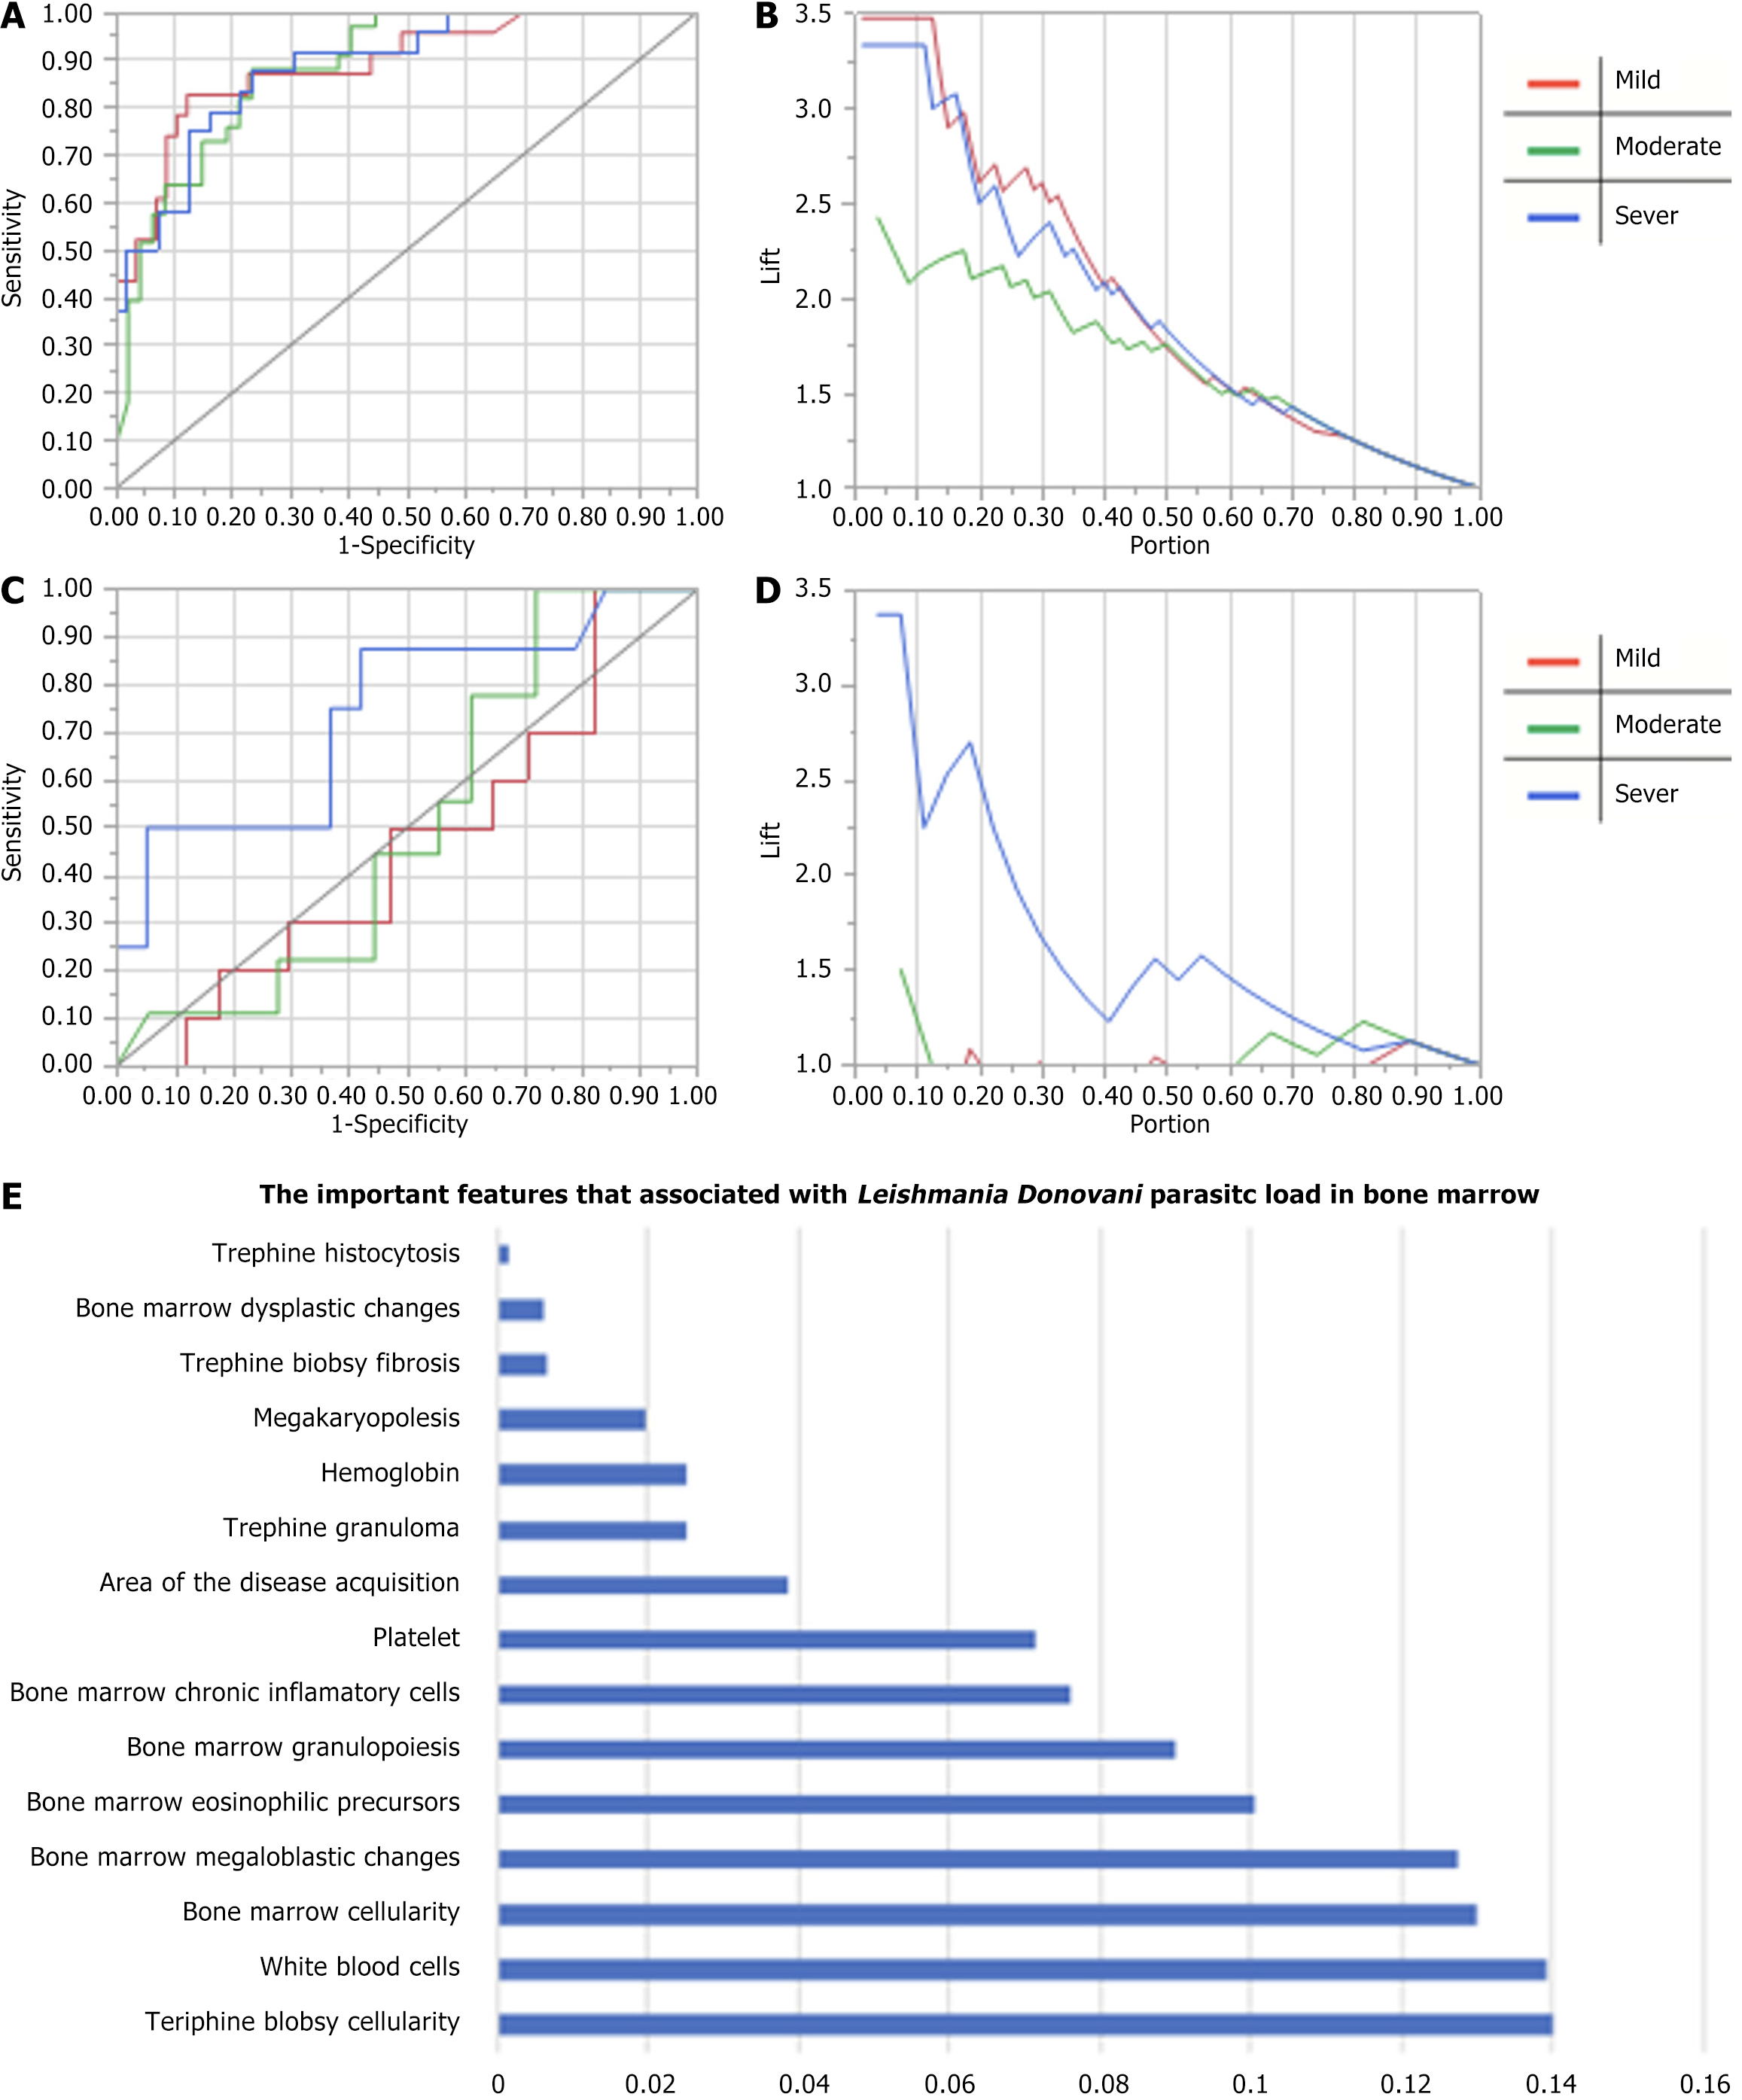
Figure 1 Model for predicting parasitic load.
A-D: Performance of the parasite load model with three target categories (mild, moderate, severe); A: ROC for training data; B: Lift curve for training data; C: ROC for validation data; D: Lift curve for validation data; E: Important features that are associated with leishmania donovani parasites load.
- Citation: Elnoor ZIA, Abdelmajeed O, Mustafa A, Gasim T, Musa SAM, Abdelmoneim AH, Omer IIA, Fadl HAO. Hematological picture of pediatric Sudanese patients with visceral leishmaniasis and prediction of leishmania donovani parasite load. World J Clin Cases 2024; 12(30): 6374-6382
- URL: https://www.wjgnet.com/2307-8960/full/v12/i30/6374.htm
- DOI: https://dx.doi.org/10.12998/wjcc.v12.i30.6374


