Copyright
©The Author(s) 2024.
World J Clin Cases. Jan 26, 2024; 12(3): 565-574
Published online Jan 26, 2024. doi: 10.12998/wjcc.v12.i3.565
Published online Jan 26, 2024. doi: 10.12998/wjcc.v12.i3.565
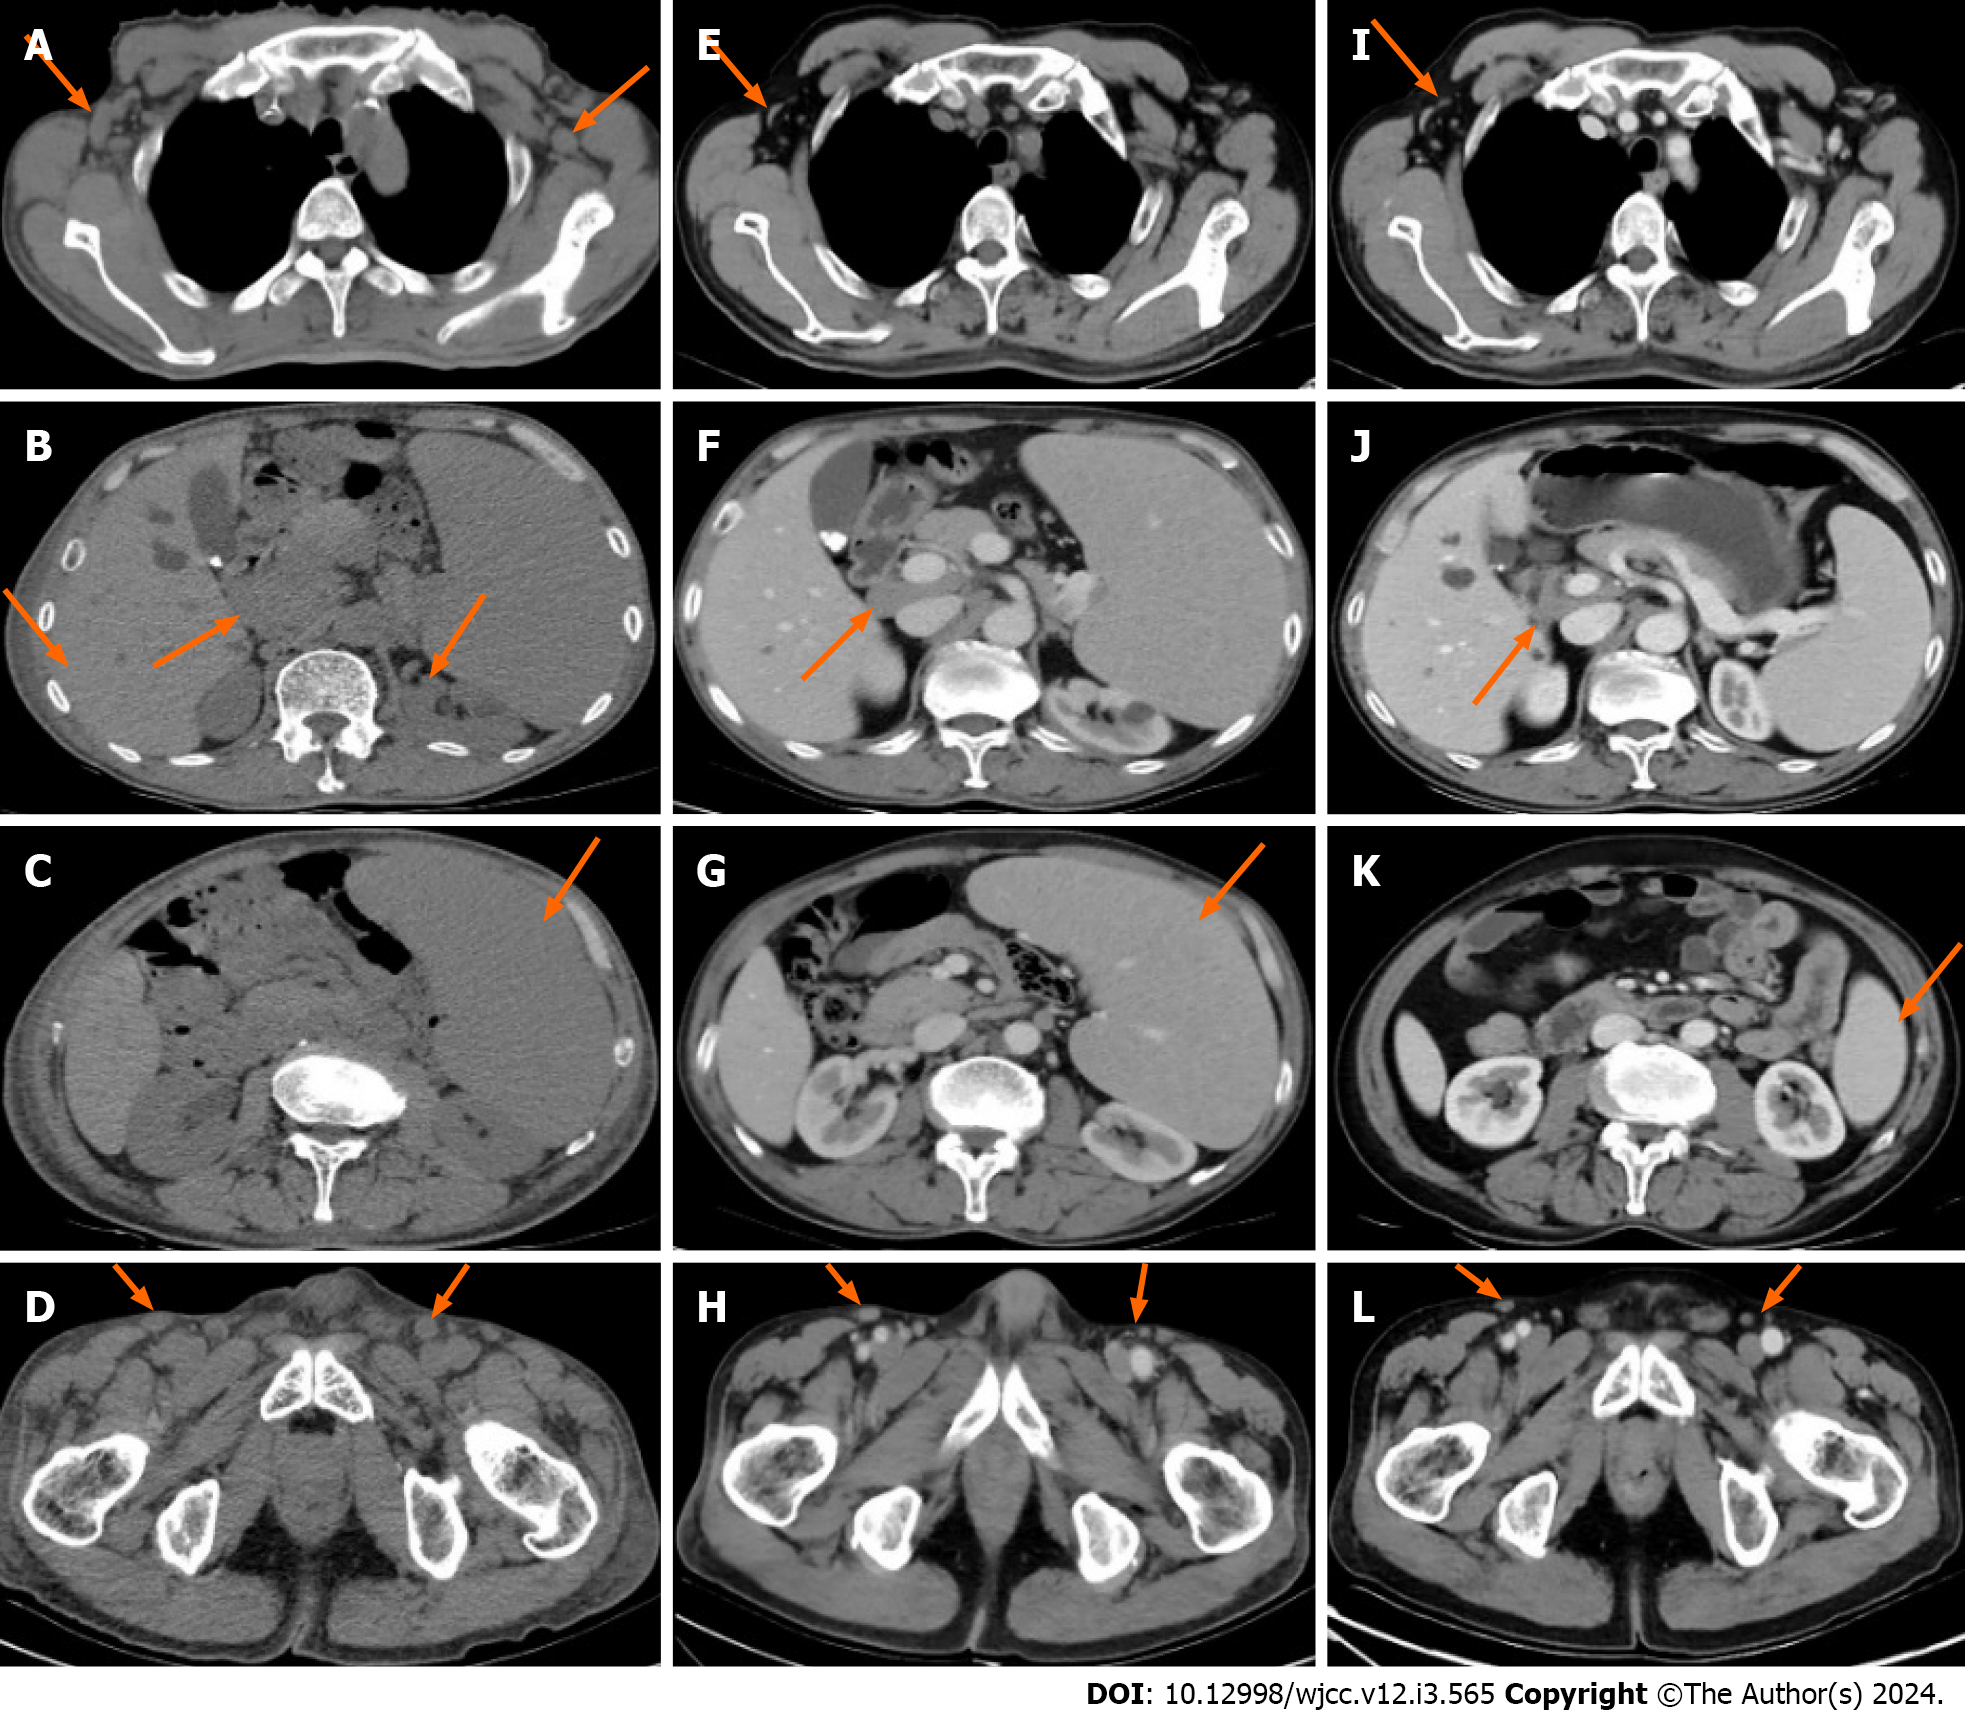
Figure 2 Computed tomography scans before and after treatment.
A-D: Computed tomography (CT) results at the time of diagnosis. Orange arrows represent axillary lymph node enlargement, hilar lymph node enlargement, splenomegaly and inguinal lymph node enlargement, respectively (orange arrow); E-H: CT results after three courses of treatment, which indicated that the lymph nodes were significantly reduced, although spleen retraction was not obvious (orange arrow); I-L: CT results after six courses of treatment, showing that the lymph nodes almost disappeared and the spleen significantly shrank (orange arrow).
- Citation: Bai SJ, Geng Y, Gao YN, Zhang CX, Mi Q, Zhang C, Yang JL, He SJ, Yan ZY, He JX. Marginal zone lymphoma with severe rashes: A case report. World J Clin Cases 2024; 12(3): 565-574
- URL: https://www.wjgnet.com/2307-8960/full/v12/i3/565.htm
- DOI: https://dx.doi.org/10.12998/wjcc.v12.i3.565


