Copyright
©The Author(s) 2024.
World J Clin Cases. Jan 26, 2024; 12(3): 479-487
Published online Jan 26, 2024. doi: 10.12998/wjcc.v12.i3.479
Published online Jan 26, 2024. doi: 10.12998/wjcc.v12.i3.479
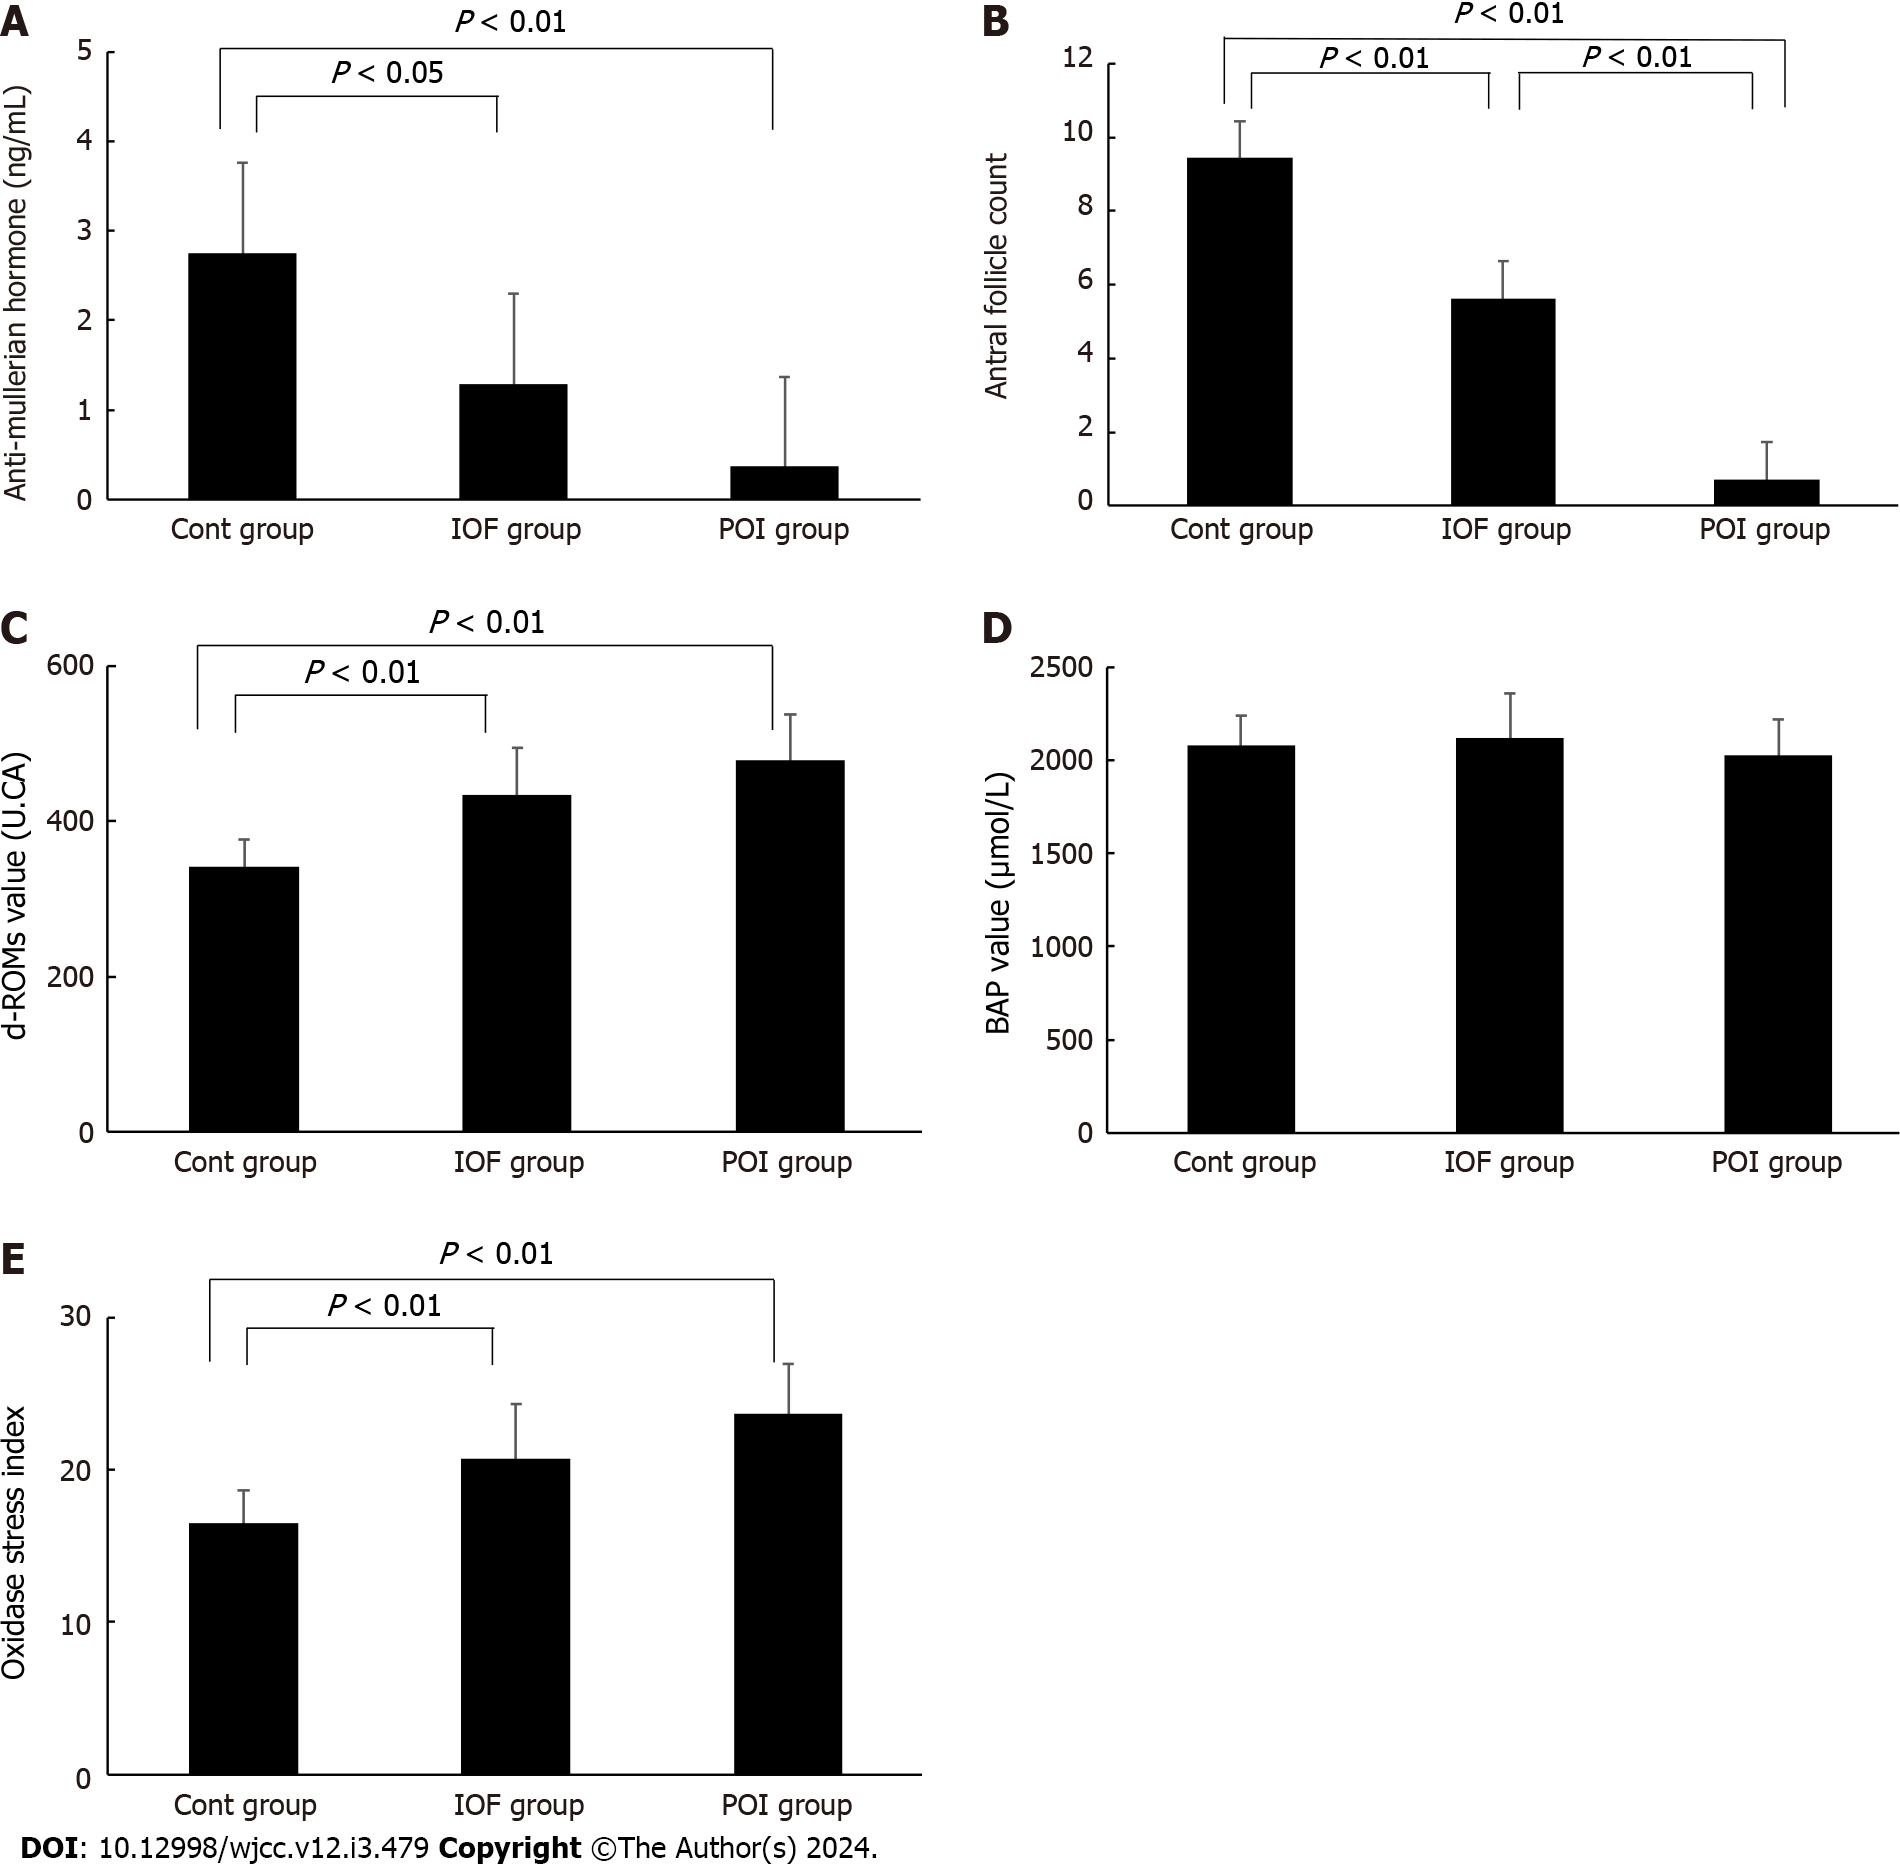
Figure 1 Comparison of anti-Mullerian hormone levels, the antral follicle count, the mean levels of plasma diacron-reactive oxygen metabolites, the mean levels of plasma biological antioxidant potential, and the mean levels of oxidative stress index.
A: Comparison of anti-Mullerian hormone levels. Values are expressed as means, with the error bar representing the standard deviation. A significant difference between the control (Cont) and premature ovarian insufficiency (POI) groups was observed (P < 0.01). A significant difference between the Cont and incipient ovarian failure (IOF) groups was observed (P < 0.05). There were no significant differences between the IOF and POI groups; B: Comparison of the antral follicle count. Values are expressed as means, with the error bar representing the standard deviation. A significant difference between the control and premature ovarian insufficiency groups was observed (P < 0.01). A significant difference between the Cont and incipient ovarian failure groups was observed (P < 0.01). A significant difference between the IOF and POI was observed (P < 0.01); C: Comparison of the mean levels of plasma diacron-reactive oxygen metabolites. Values are expressed as means, with the error bar representing the standard deviation. A significant difference between the control and incipient ovarian failure groups was observed (P < 0.01). A significant difference between the Cont and premature ovarian insufficiency groups was observed (P < 0.01). There were no significant differences between the IOF and POI groups; D: Comparison of the mean levels of plasma biological antioxidant potential. Values are expressed as means, with the error bar representing the standard deviation. There were no significant differences among the three groups; E: Comparison of the mean levels of oxidative stress index. Values are expressed as means, with the error bar representing the standard deviation. A significant difference between the control and incipient ovarian failure groups was observed (P < 0.01). A significant difference between the Cont and premature ovarian insufficiency groups was observed (P < 0.01). There were no significant differences between the IOF and POI groups. BAP: Biological antioxidant potential; Cont: Control; IOF: Incipient ovarian failure; POI: Premature ovarian insufficiency; d-ROMs: Diacron-reactive oxygen metabolites.
- Citation: Kakinuma K, Kakinuma T. Significance of oxidative stress and antioxidant capacity tests as biomarkers of premature ovarian insufficiency: A case control study. World J Clin Cases 2024; 12(3): 479-487
- URL: https://www.wjgnet.com/2307-8960/full/v12/i3/479.htm
- DOI: https://dx.doi.org/10.12998/wjcc.v12.i3.479


