Copyright
©The Author(s) 2024.
World J Clin Cases. Sep 26, 2024; 12(27): 6094-6104
Published online Sep 26, 2024. doi: 10.12998/wjcc.v12.i27.6094
Published online Sep 26, 2024. doi: 10.12998/wjcc.v12.i27.6094
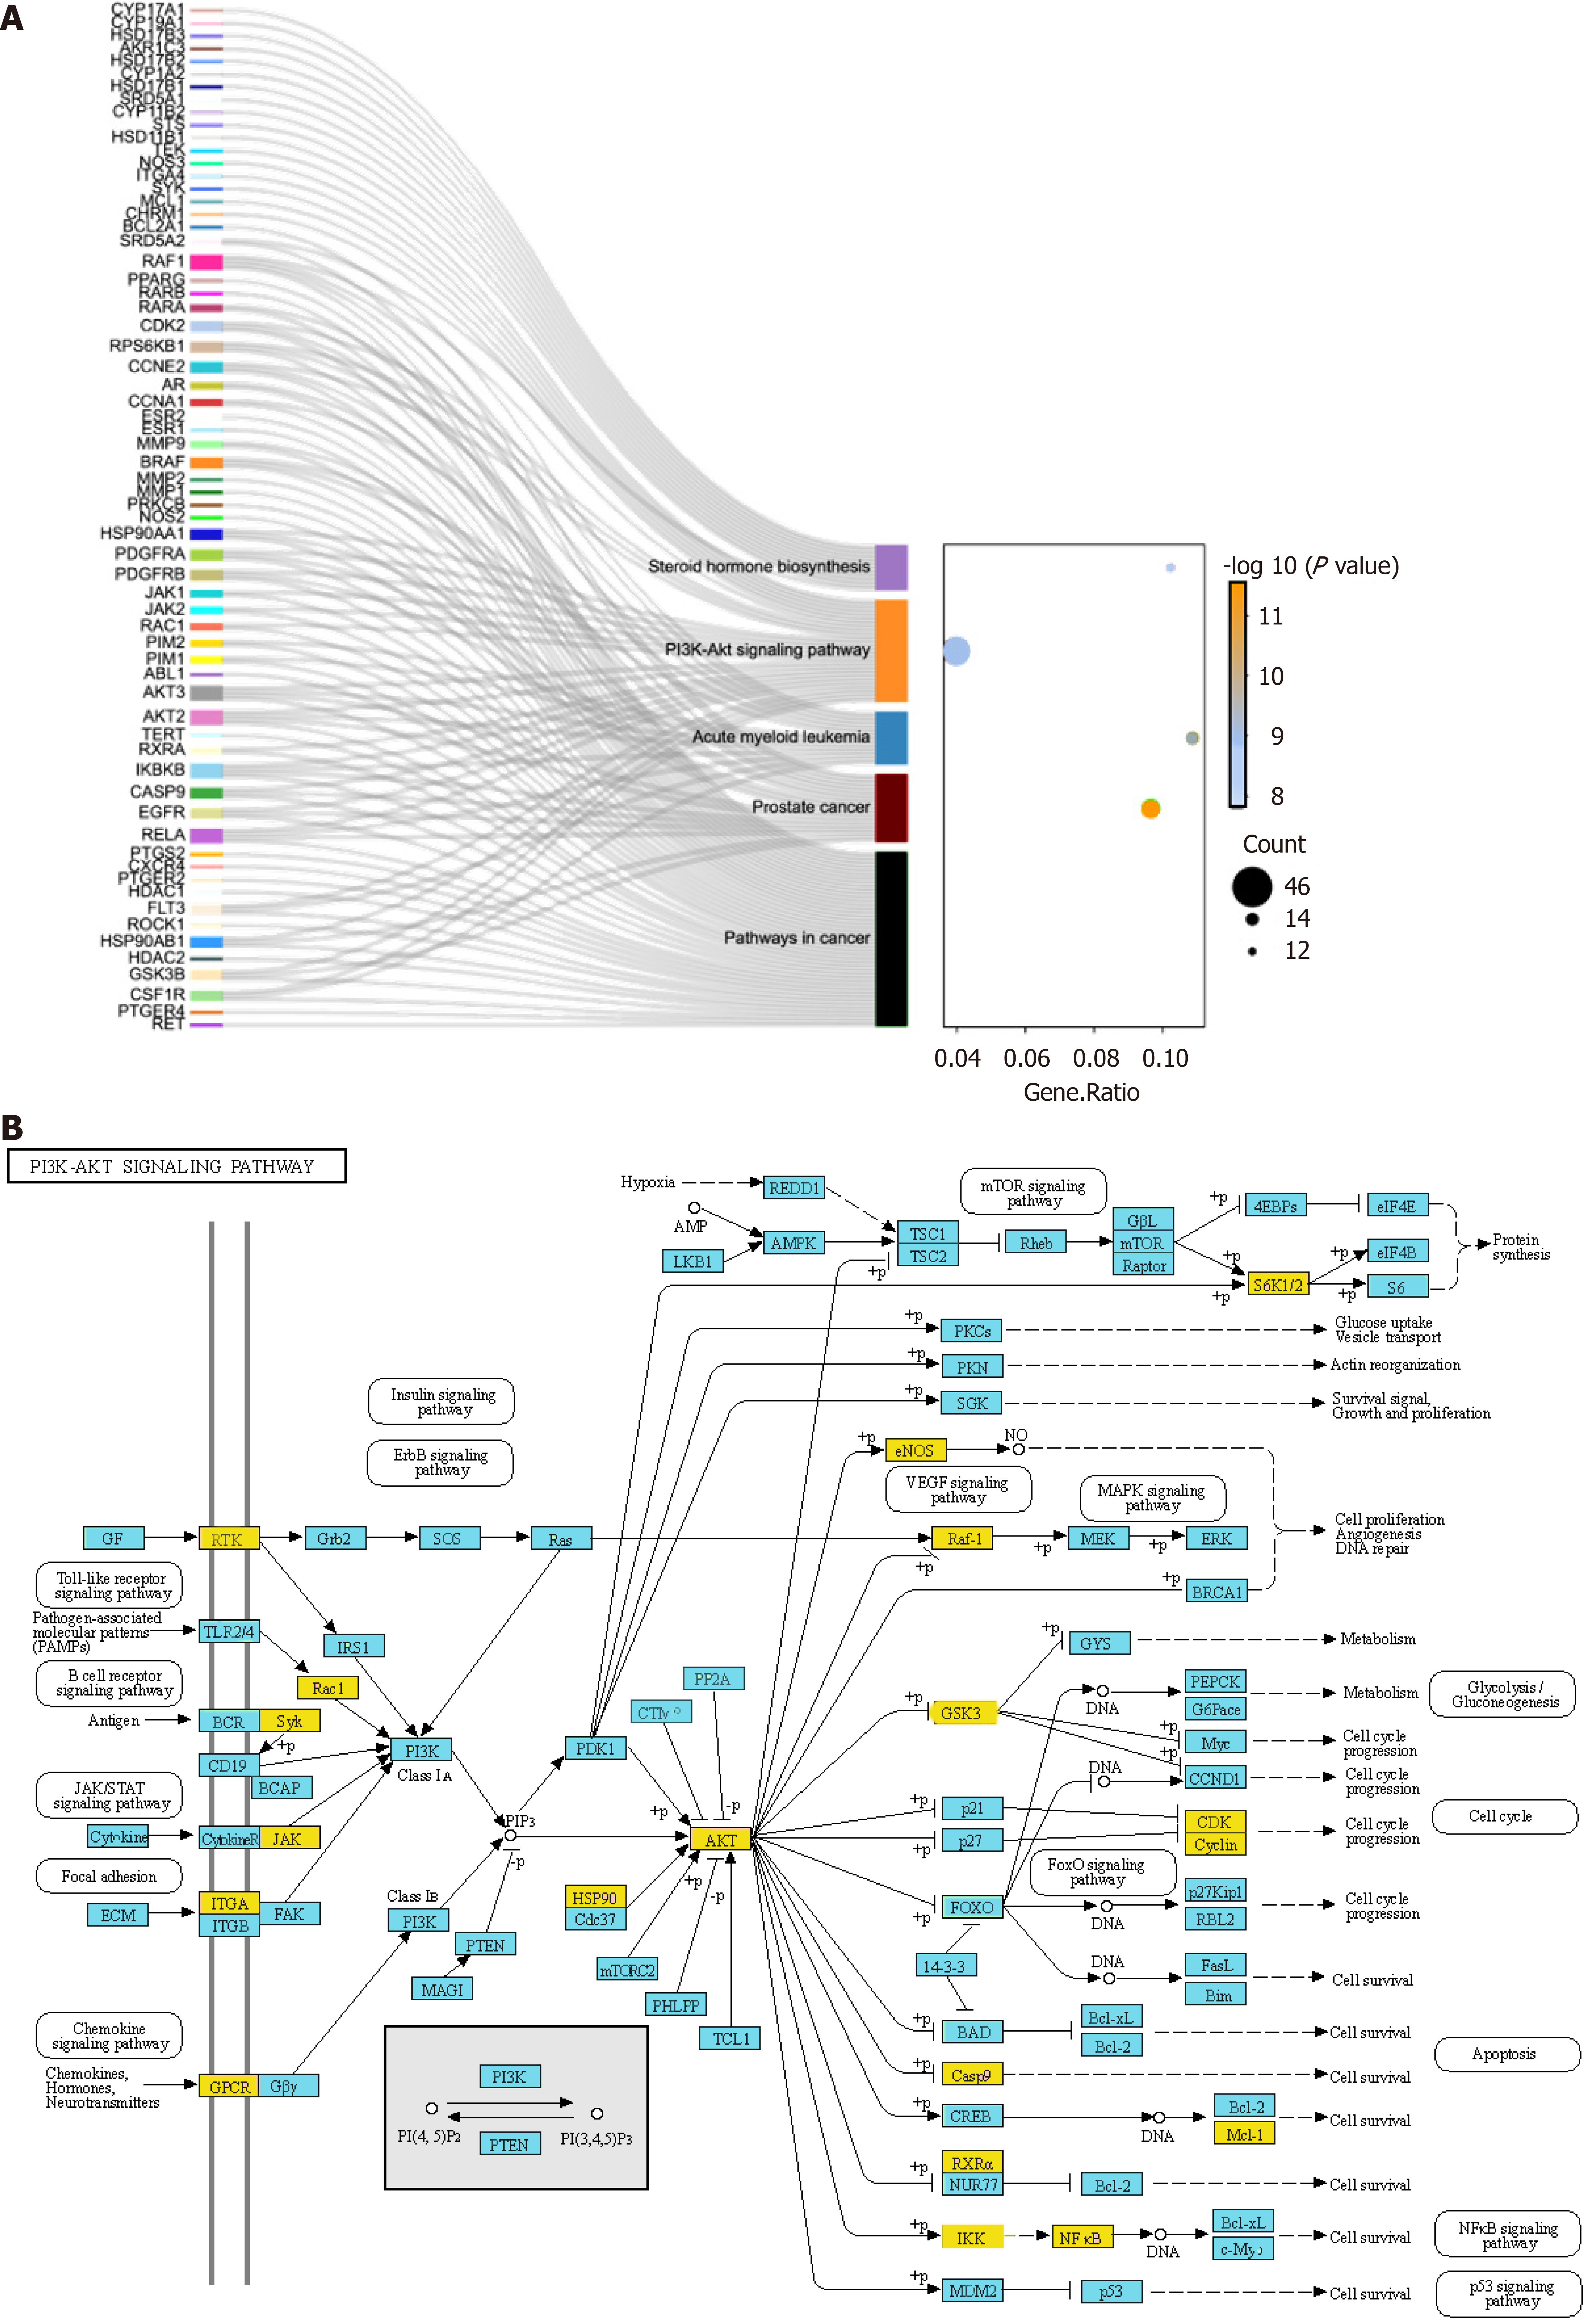
Figure 5 Sankey diagram of the top 5 pathways (selected according to the P value) and the main involved pathways.
A: The different coloured rectangles on the left of the figure represent potential target genes; B: Reprinted images of the PI3K-Akt signalling pathway. Gene ratio: Count/set size.
- Citation: Zhang M, Ma J, Zeng FY, Hou XH. Network pharmacology combined with molecular docking revealed the potential targets of Coridius chinensis in prostate cancer treatment. World J Clin Cases 2024; 12(27): 6094-6104
- URL: https://www.wjgnet.com/2307-8960/full/v12/i27/6094.htm
- DOI: https://dx.doi.org/10.12998/wjcc.v12.i27.6094


