Copyright
©The Author(s) 2024.
World J Clin Cases. Sep 6, 2024; 12(25): 5681-5696
Published online Sep 6, 2024. doi: 10.12998/wjcc.v12.i25.5681
Published online Sep 6, 2024. doi: 10.12998/wjcc.v12.i25.5681
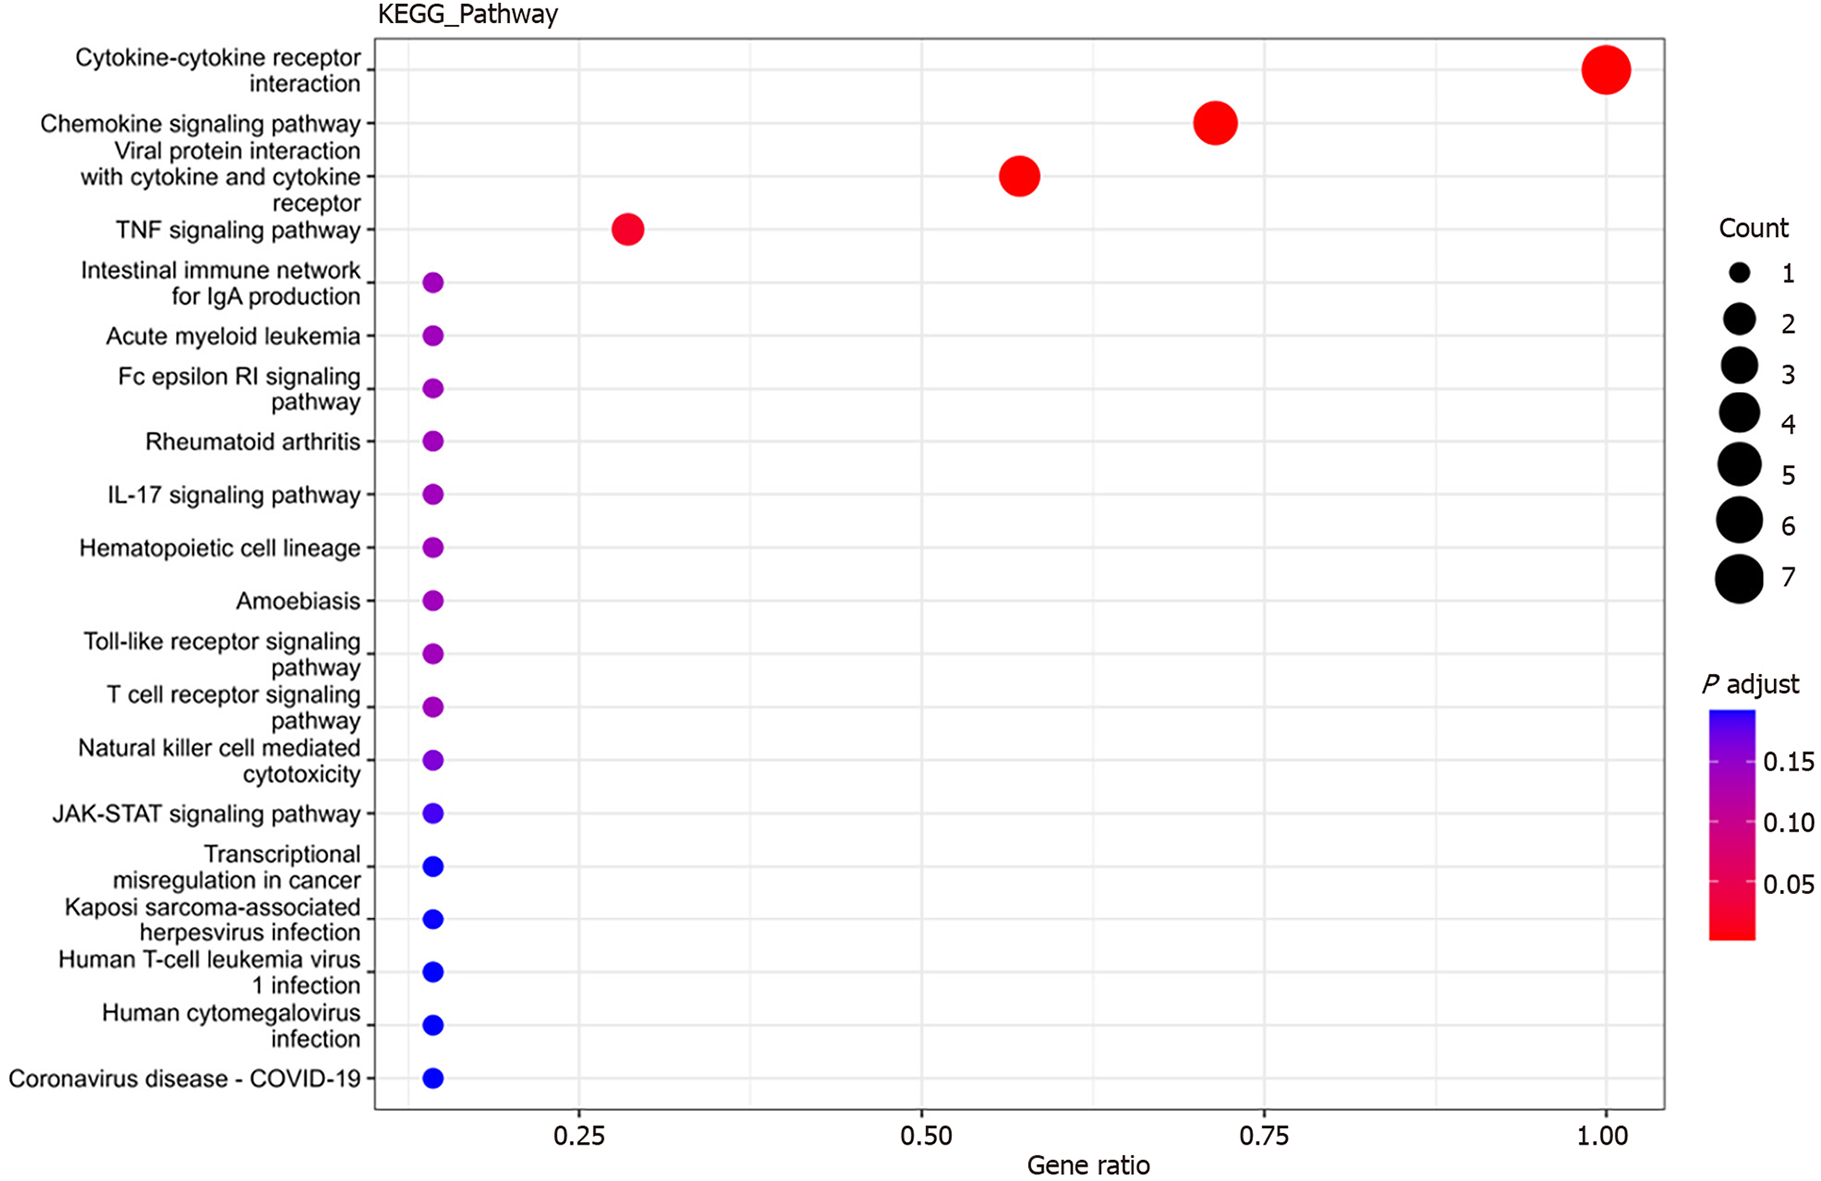
Figure 6 Bubble plot of Kyoto Encyclopedia of Genes and Genomes pathways associated with differentially expressed cytokines.
The x-axis represents the ratio of differential genes in Kyoto Encyclopedia of Genes and Genomes (KEGG) pathways to the total number of differentially expressed genes (GeneRatio). A higher ratio indicates a greater degree of protein enrichment. The y-axis represents the corresponding KEGG pathway names, with bubble size indicating the number of genes annotated to the KEGG pathway. Larger bubbles represent a greater number of enriched proteins. The color gradient from blue to red indicates decreasing P values, signifying greater significance. KEGG: Kyoto Encyclopedia of Genes and Genomes.
- Citation: Liu HX, Wang YY, Yang XF. Differential expression of plasma cytokines in sepsis patients and their clinical implications. World J Clin Cases 2024; 12(25): 5681-5696
- URL: https://www.wjgnet.com/2307-8960/full/v12/i25/5681.htm
- DOI: https://dx.doi.org/10.12998/wjcc.v12.i25.5681


