Copyright
©The Author(s) 2024.
World J Clin Cases. Sep 6, 2024; 12(25): 5681-5696
Published online Sep 6, 2024. doi: 10.12998/wjcc.v12.i25.5681
Published online Sep 6, 2024. doi: 10.12998/wjcc.v12.i25.5681
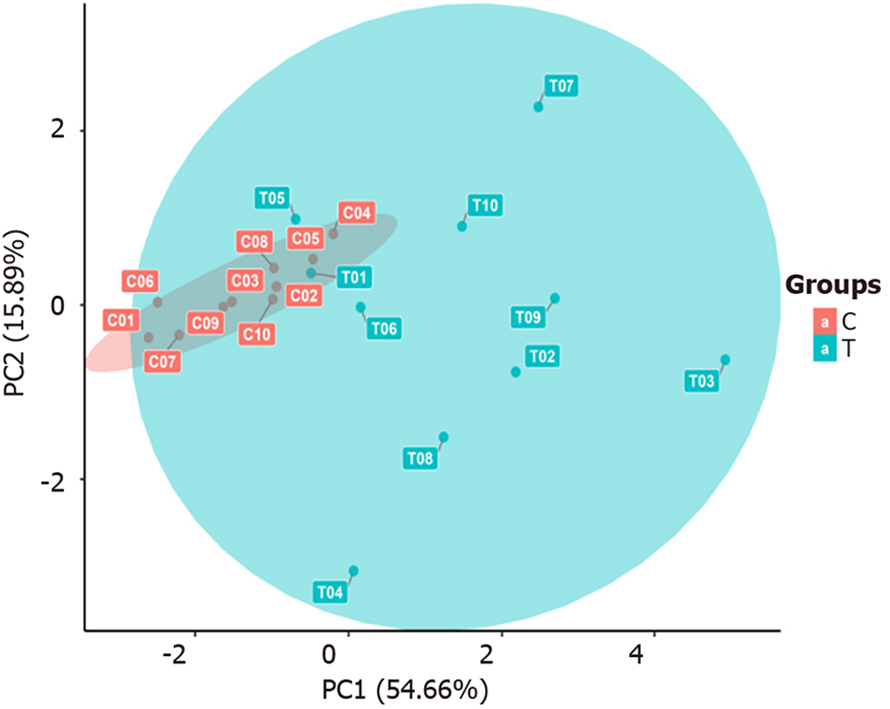
Figure 4 Plot of the principal component analysis results.
The horizontal axis represents the first principal component, and the vertical axis represents the second principal component. T: The sepsis group; C: The non-sepsis control group.
- Citation: Liu HX, Wang YY, Yang XF. Differential expression of plasma cytokines in sepsis patients and their clinical implications. World J Clin Cases 2024; 12(25): 5681-5696
- URL: https://www.wjgnet.com/2307-8960/full/v12/i25/5681.htm
- DOI: https://dx.doi.org/10.12998/wjcc.v12.i25.5681


