Copyright
©The Author(s) 2024.
World J Clin Cases. Sep 6, 2024; 12(25): 5681-5696
Published online Sep 6, 2024. doi: 10.12998/wjcc.v12.i25.5681
Published online Sep 6, 2024. doi: 10.12998/wjcc.v12.i25.5681
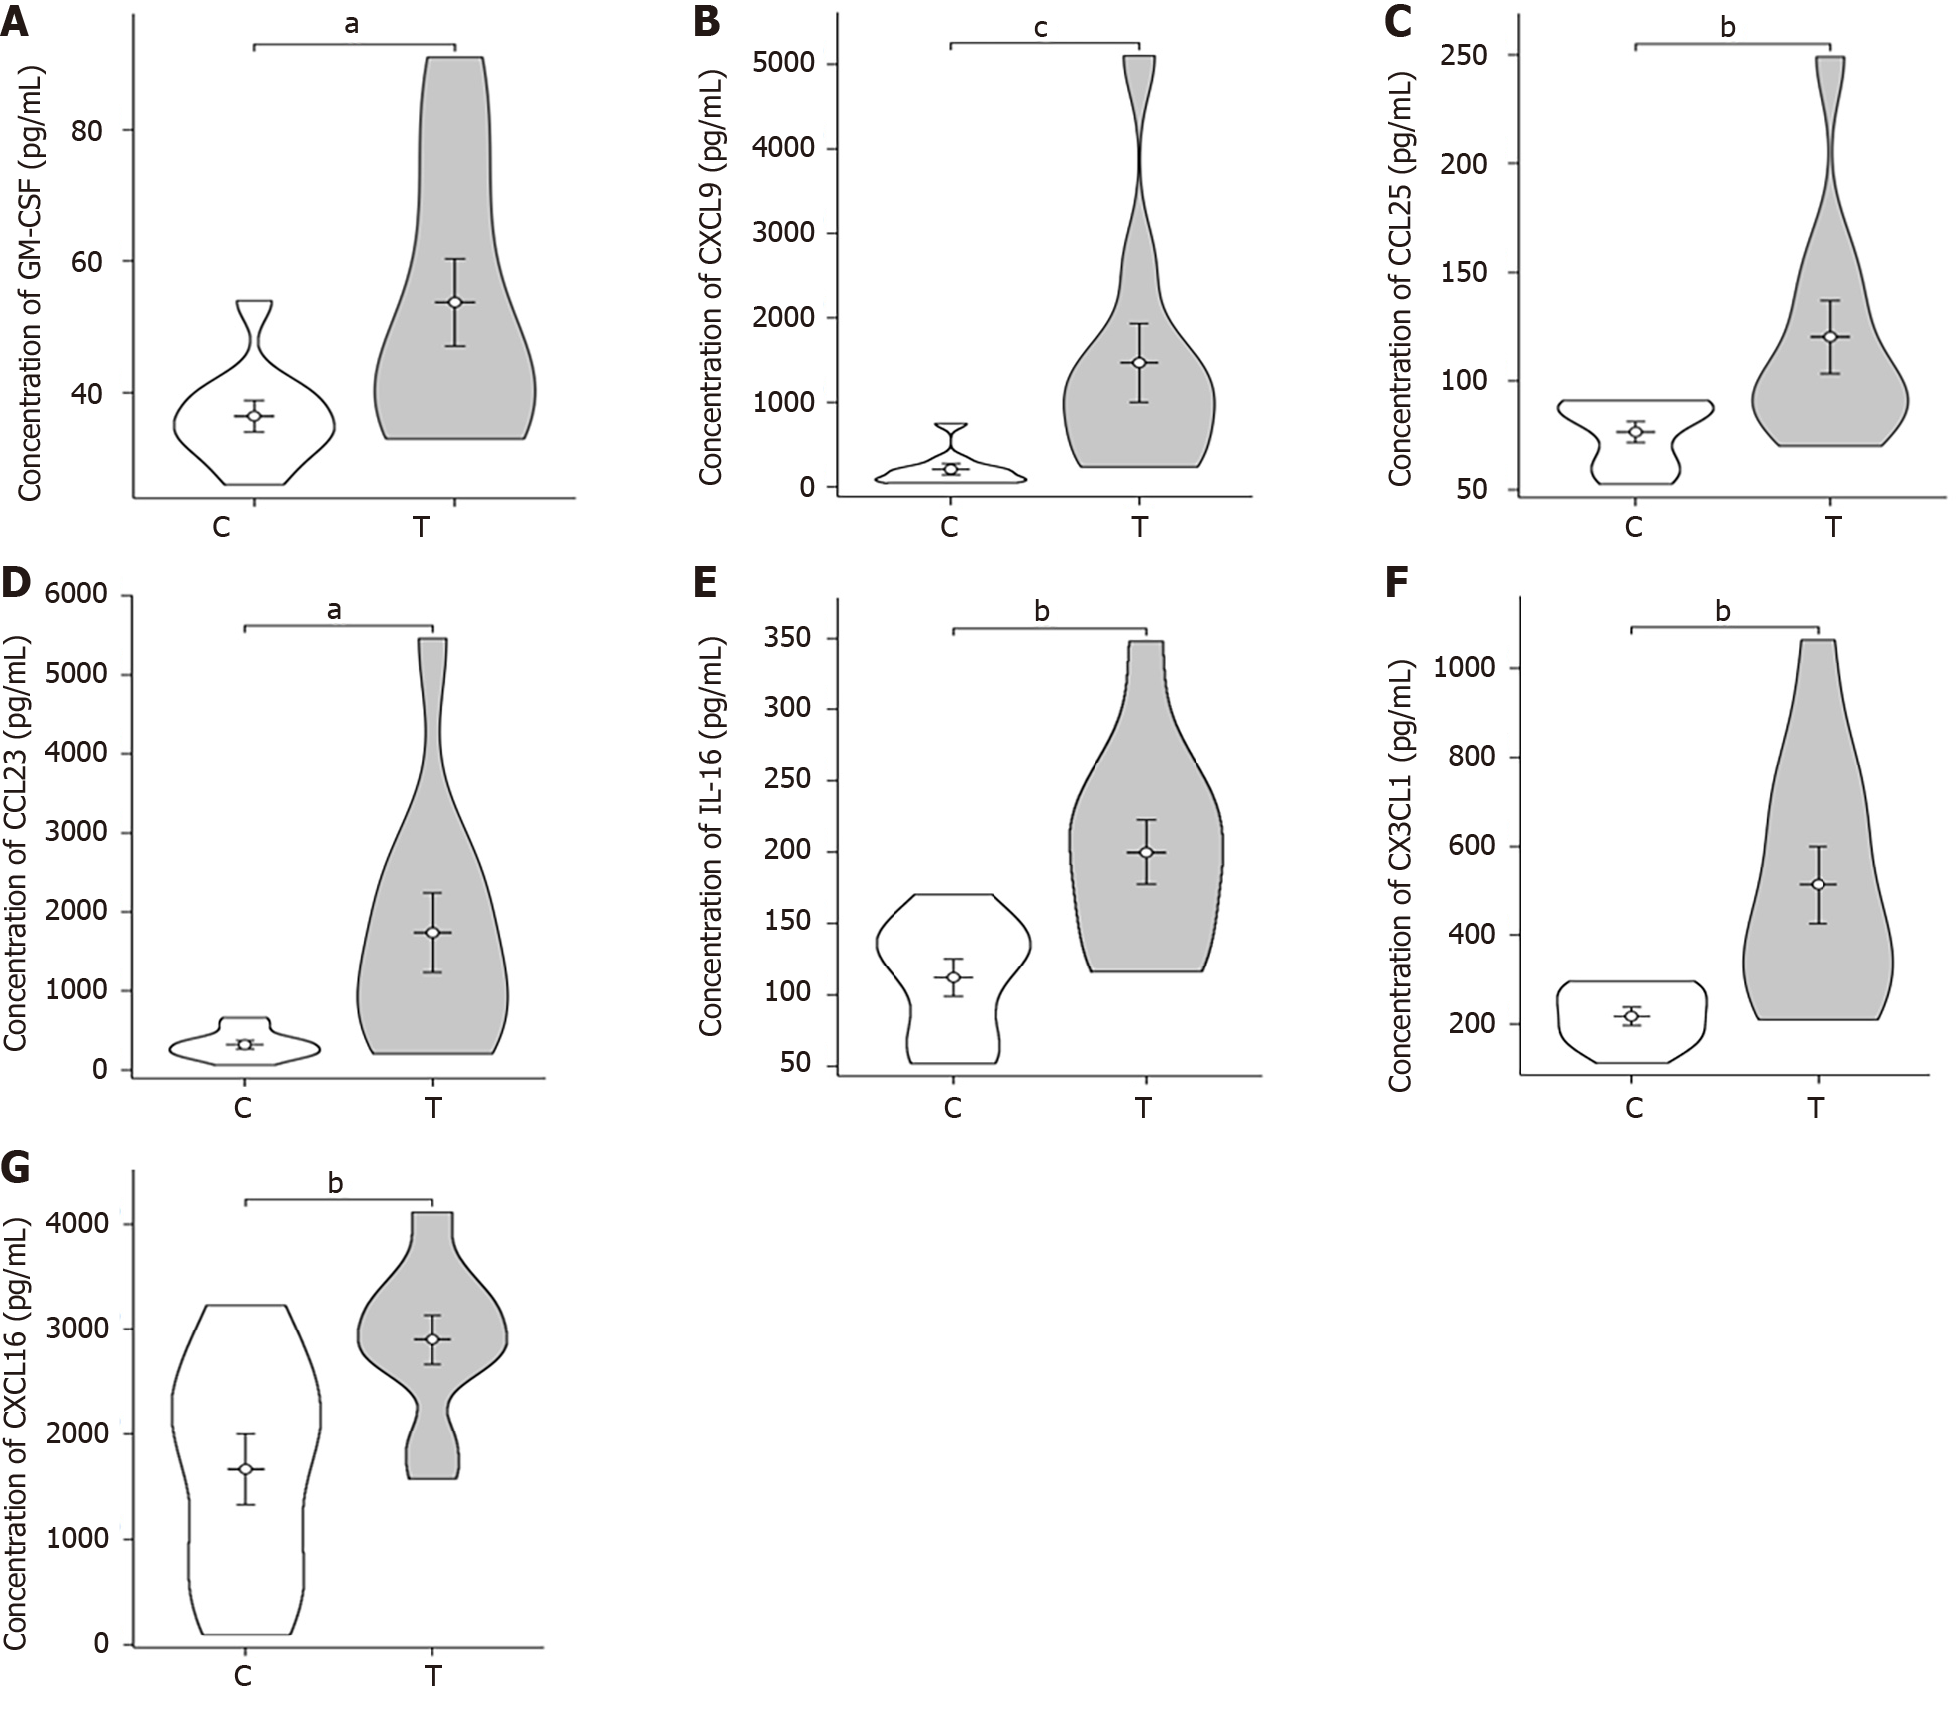
Figure 3 Violin plots of differential expression of plasma cytokine in patient both sepsis and non-sepsis groups.
A: Differential expression of plasma colony-stimulating factor; B: Differential expression of plasma CXCL9; C: Differential expression of plasma CCL25; D: Differential expression of plasma CCL23; E: Differential expression of plasma interleukin-16; F: Differential expression of plasma CX3CL1; G: Differential expression of plasma CXCL16. aP < 0.05; bP < 0.01; cP < 0.001. T: The sepsis group; C: The non-sepsis control group; GM-CSF: Granulocyte-macrophage colony-stimulating factor; Interleukin-16: IL-16.
- Citation: Liu HX, Wang YY, Yang XF. Differential expression of plasma cytokines in sepsis patients and their clinical implications. World J Clin Cases 2024; 12(25): 5681-5696
- URL: https://www.wjgnet.com/2307-8960/full/v12/i25/5681.htm
- DOI: https://dx.doi.org/10.12998/wjcc.v12.i25.5681


