Copyright
©The Author(s) 2024.
World J Clin Cases. Aug 26, 2024; 12(24): 5483-5491
Published online Aug 26, 2024. doi: 10.12998/wjcc.v12.i24.5483
Published online Aug 26, 2024. doi: 10.12998/wjcc.v12.i24.5483
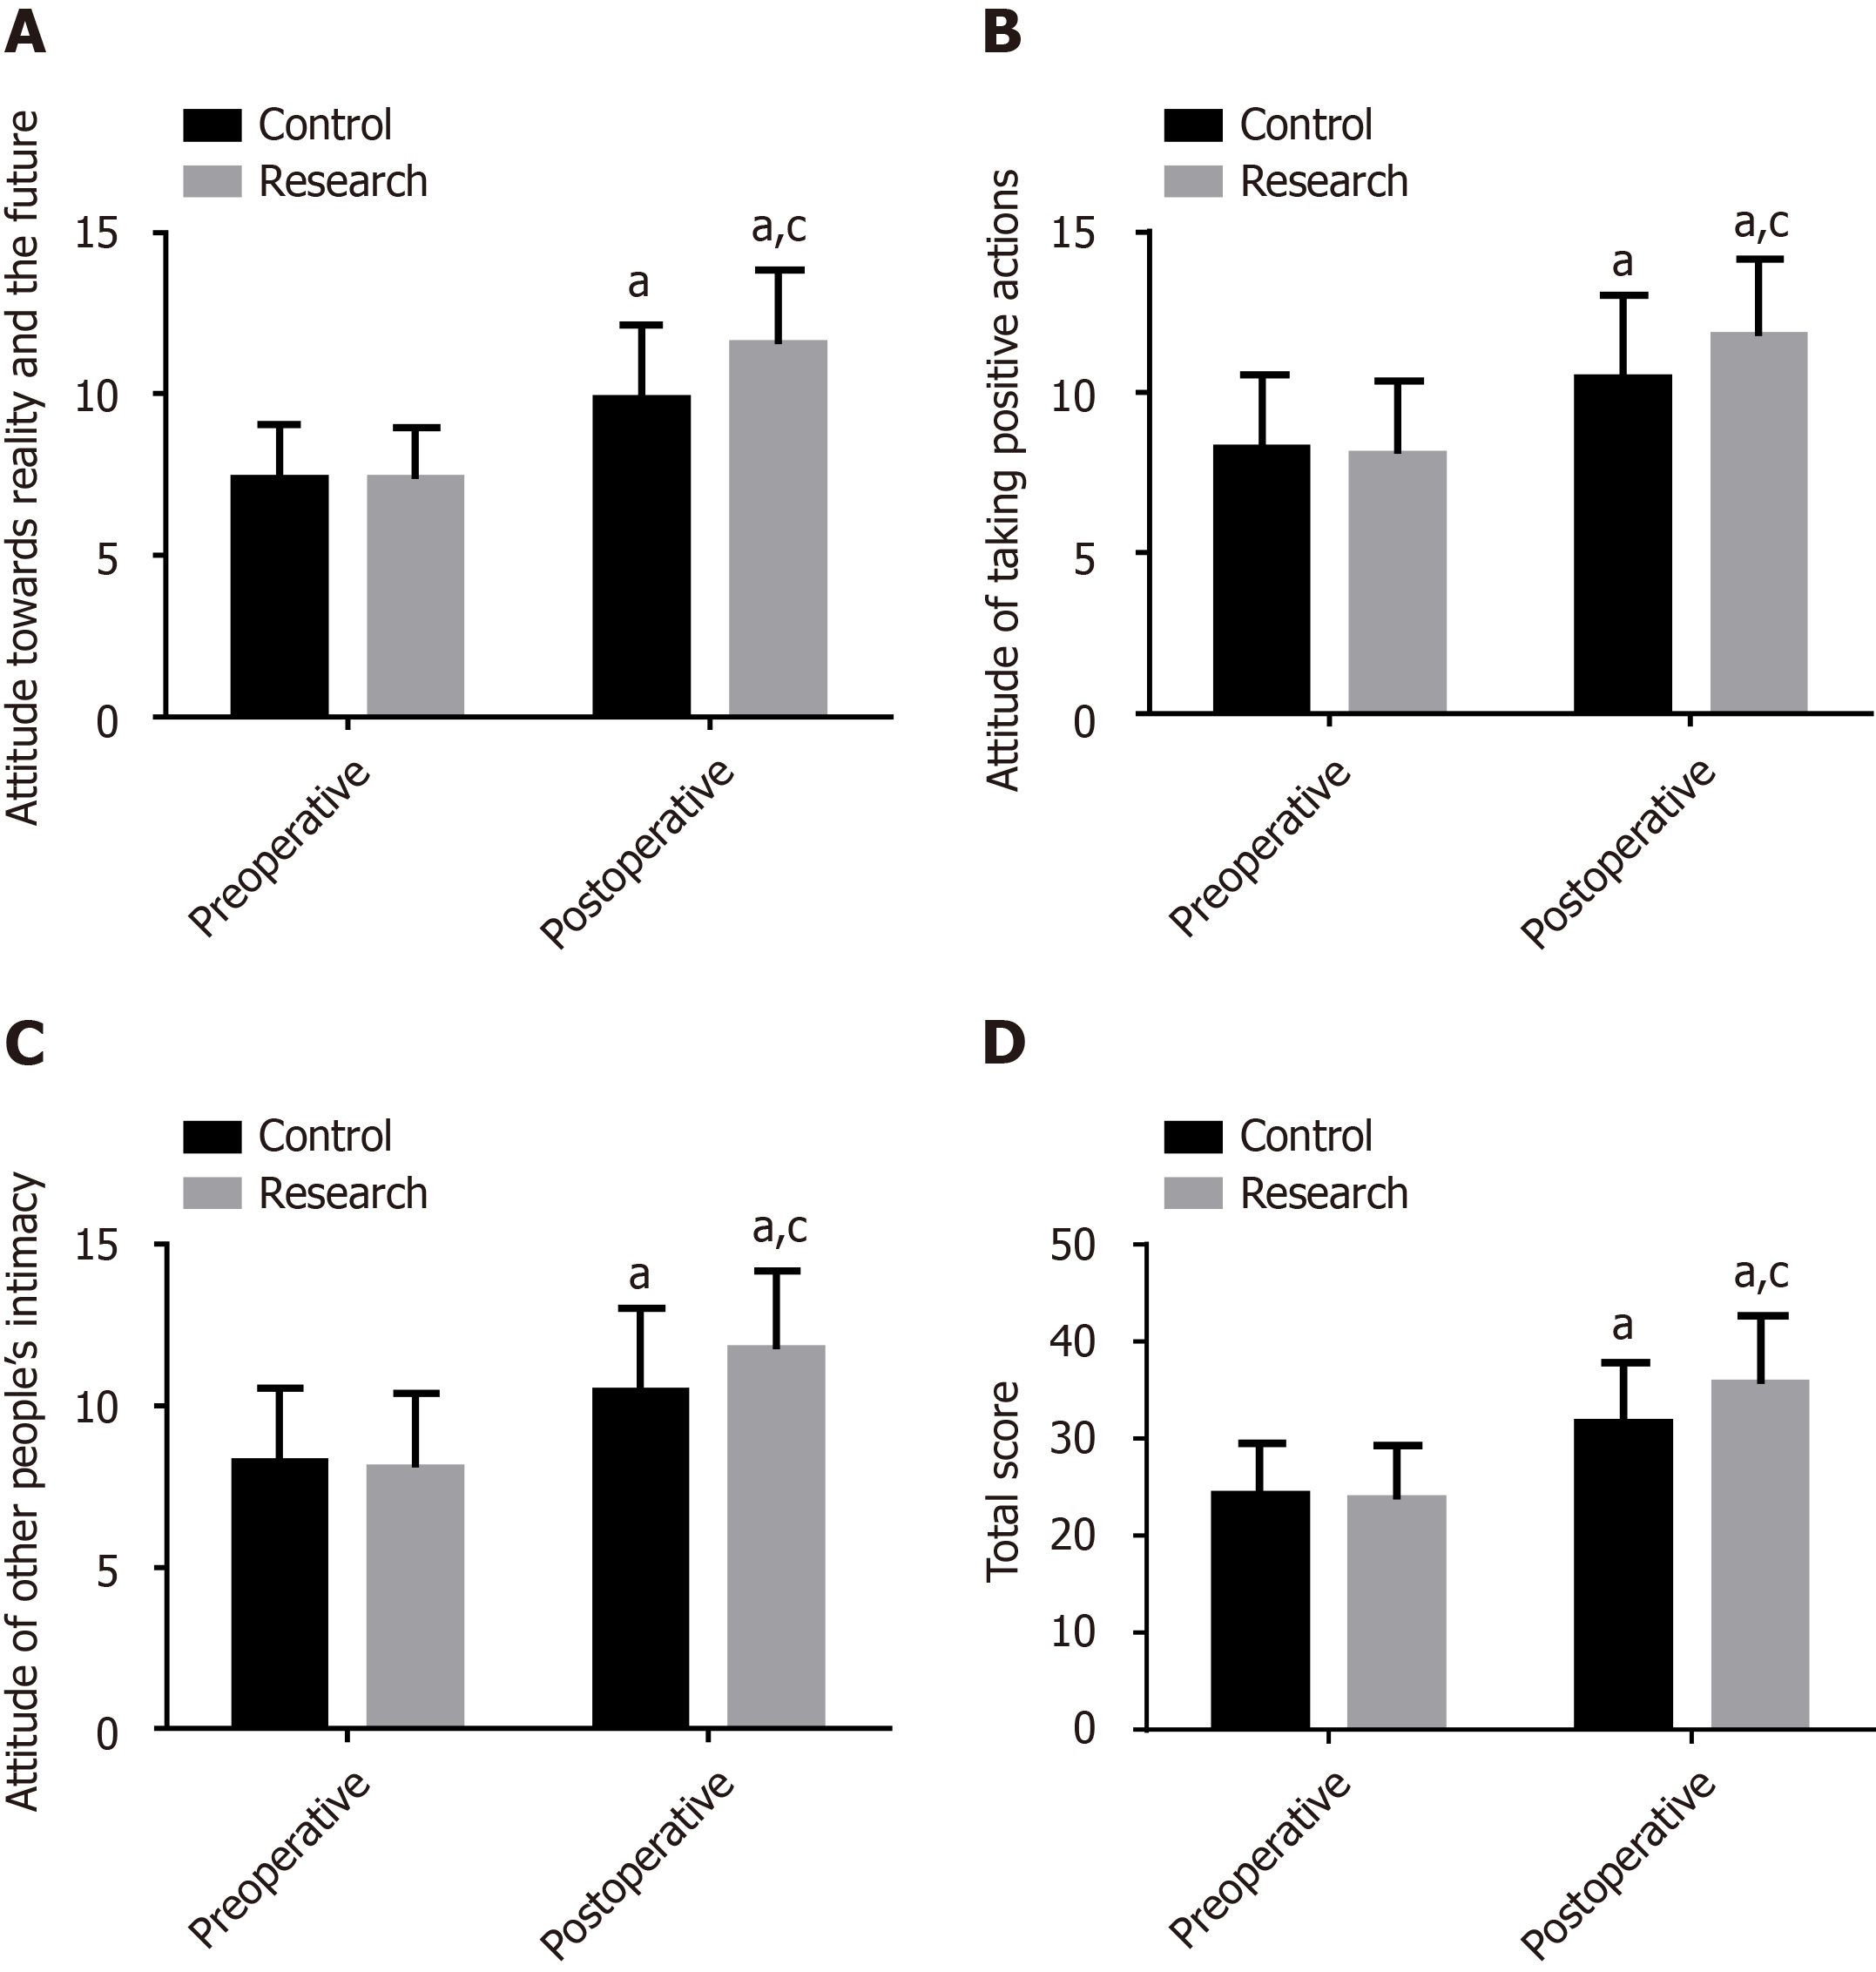
Figure 4 Comparison of life hope scores at different surgical stages.
A: Temporality and future scores; B: Positive readiness and expectancy scores; C: Interconnectedness scores. D: Total Herth Hope Index scores. aP < 0.05 within the group before and after treatment. cP < 0.05 compared with the control group at the same surgical stage.
- Citation: Wang XP, Niu M. Influence of humanistic care-based operating room nursing on safety, recovery, and satisfaction after radical surgery for colorectal carcinoma. World J Clin Cases 2024; 12(24): 5483-5491
- URL: https://www.wjgnet.com/2307-8960/full/v12/i24/5483.htm
- DOI: https://dx.doi.org/10.12998/wjcc.v12.i24.5483


