Copyright
©The Author(s) 2024.
World J Clin Cases. Aug 16, 2024; 12(23): 5329-5337
Published online Aug 16, 2024. doi: 10.12998/wjcc.v12.i23.5329
Published online Aug 16, 2024. doi: 10.12998/wjcc.v12.i23.5329
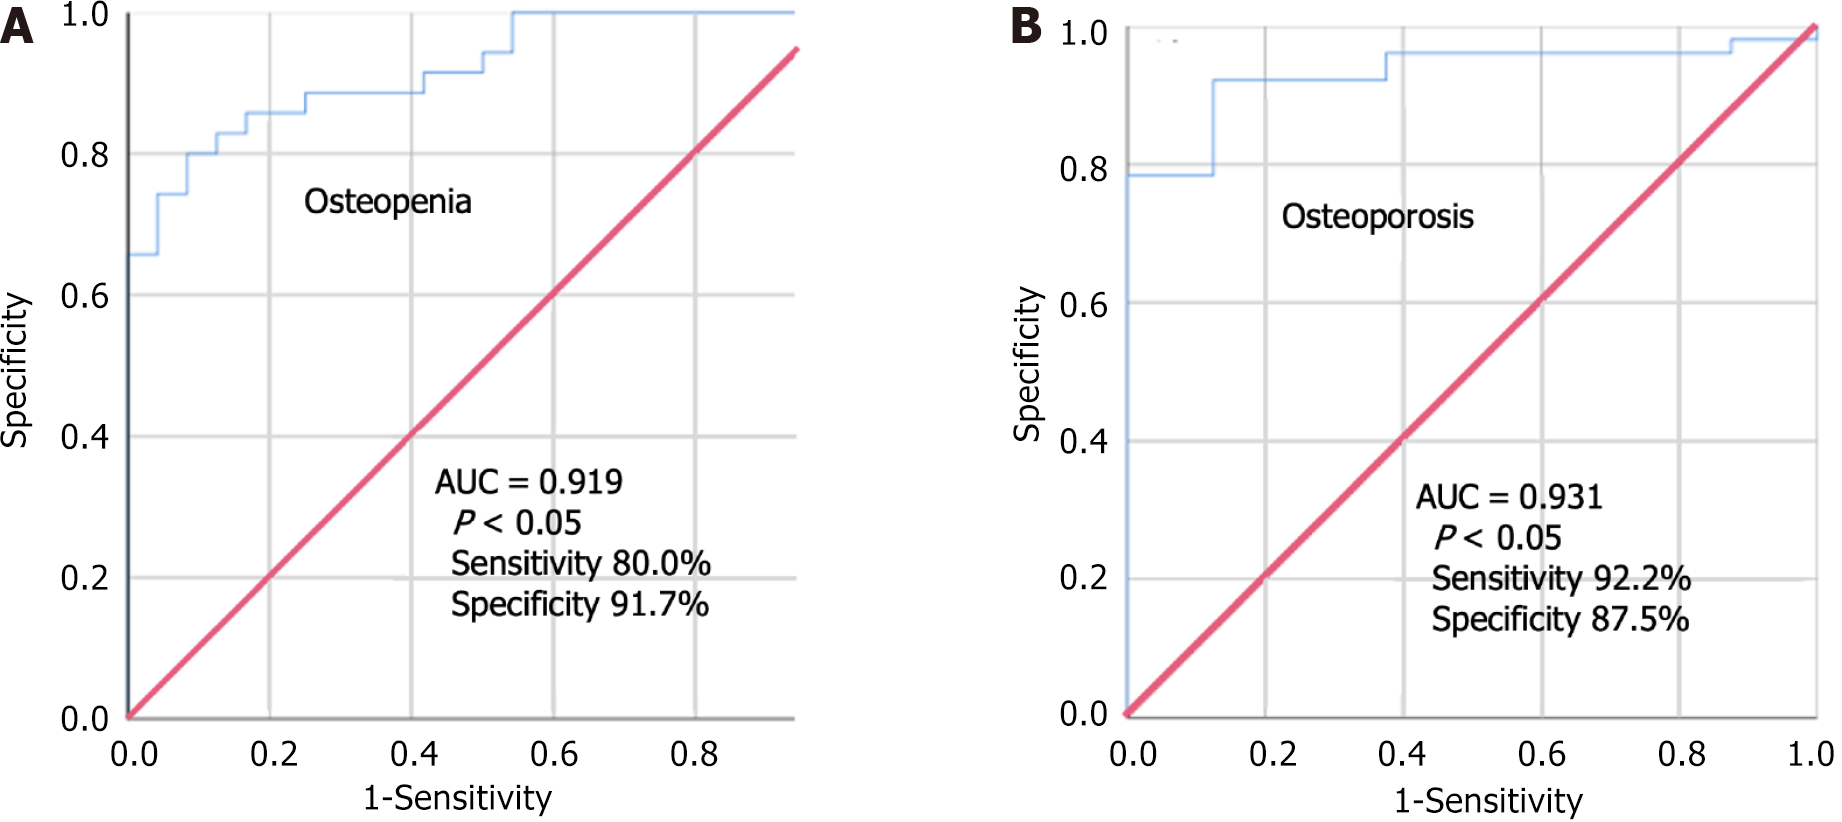
Figure 3 Receiver operation characteristic curve to diagnose osteopenia and osteoporosis.
A: Hounsfield unit measurement had a sensitivity of 92.2% and specificity of 87.5% with an area under the curve (AUC) of 0.931 (P < 0.05) in diagnosing osteopenia; B: Hounsfield unit measurement had a sensitivity of 80.0% and specificity of 91.7% with an AUC of 0.919 (P < 0.05) in diagnosing osteoporosis.
- Citation: Gao ZY, Peng WL, Li Y, Lu XH. Hounsfield units in assessing bone mineral density in ankylosing spondylitis patients with cervical fracture-dislocation. World J Clin Cases 2024; 12(23): 5329-5337
- URL: https://www.wjgnet.com/2307-8960/full/v12/i23/5329.htm
- DOI: https://dx.doi.org/10.12998/wjcc.v12.i23.5329


