Copyright
©The Author(s) 2024.
World J Clin Cases. Aug 6, 2024; 12(22): 4897-4904
Published online Aug 6, 2024. doi: 10.12998/wjcc.v12.i22.4897
Published online Aug 6, 2024. doi: 10.12998/wjcc.v12.i22.4897
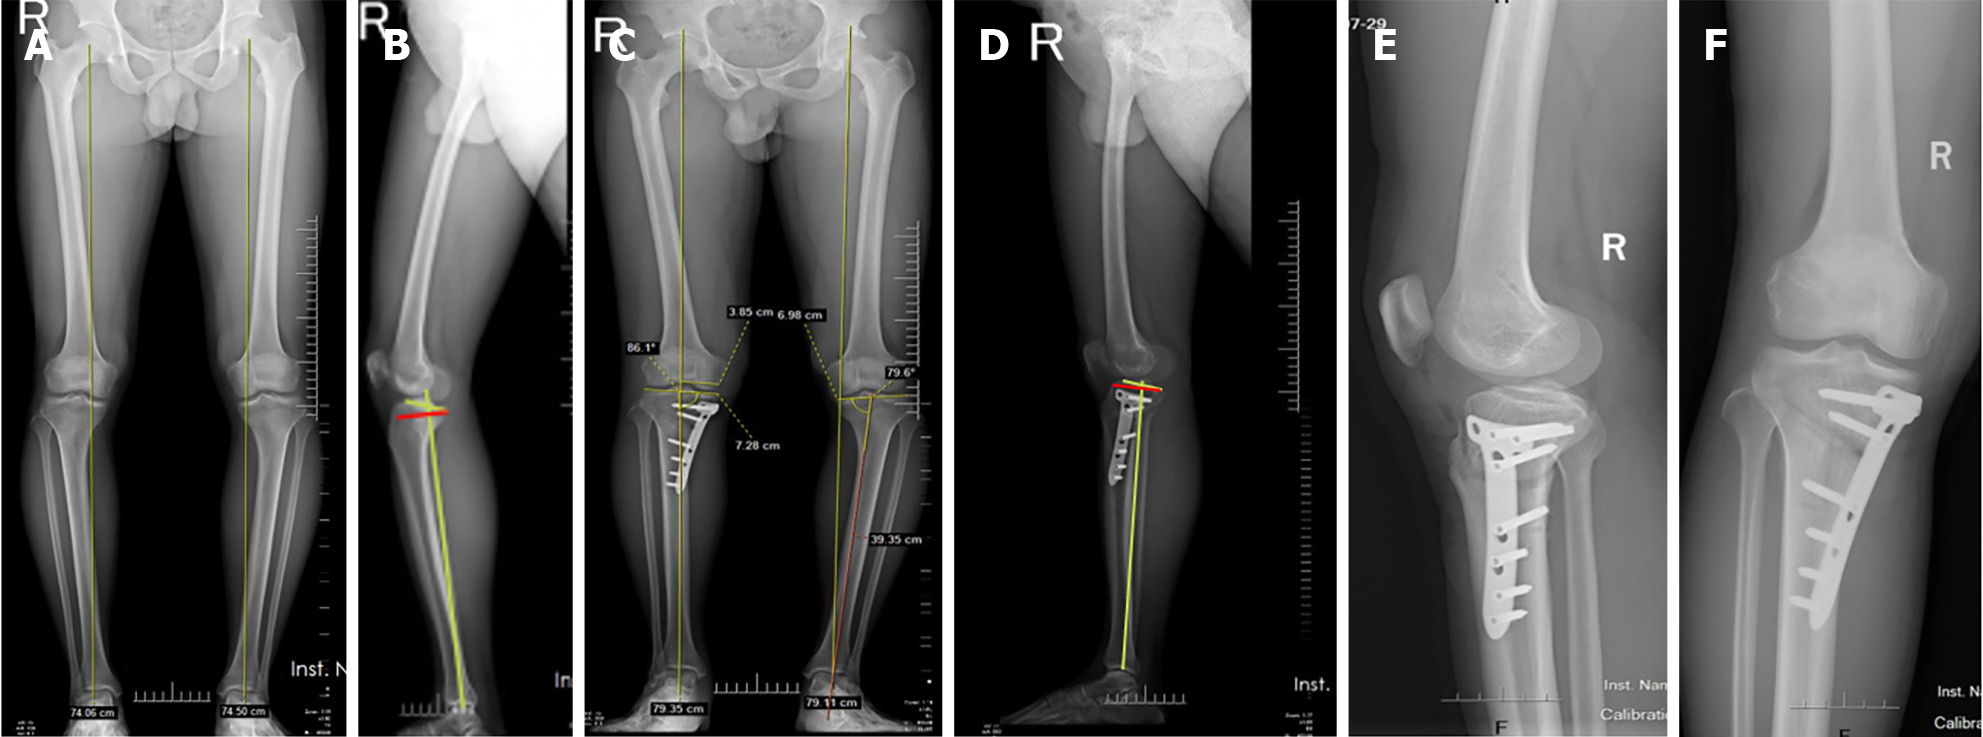
Figure 3 Knee imaging findings.
A: Radiograph showing left knee varus deformity, and the preoperative force line was 12%; B: Preoperative posterior tibial slope was 14 degrees; C: Radiograph showing the postoperative line of force position was 52%; D: Postoperative posterior tibial slope was 9 degrees; E and F: At last follow-up, X-ray indicated that the osteotomy area was well healed, with no nonunion, loss of correction, etc.
- Citation: Deng FY, Liu JC, Li Z. Osteotomy combined with anterior cruciate ligament reconstruction for anterior cruciate ligament injury and biplanar deformity. World J Clin Cases 2024; 12(22): 4897-4904
- URL: https://www.wjgnet.com/2307-8960/full/v12/i22/4897.htm
- DOI: https://dx.doi.org/10.12998/wjcc.v12.i22.4897


