Copyright
©The Author(s) 2024.
World J Clin Cases. Jul 26, 2024; 12(21): 4632-4641
Published online Jul 26, 2024. doi: 10.12998/wjcc.v12.i21.4632
Published online Jul 26, 2024. doi: 10.12998/wjcc.v12.i21.4632
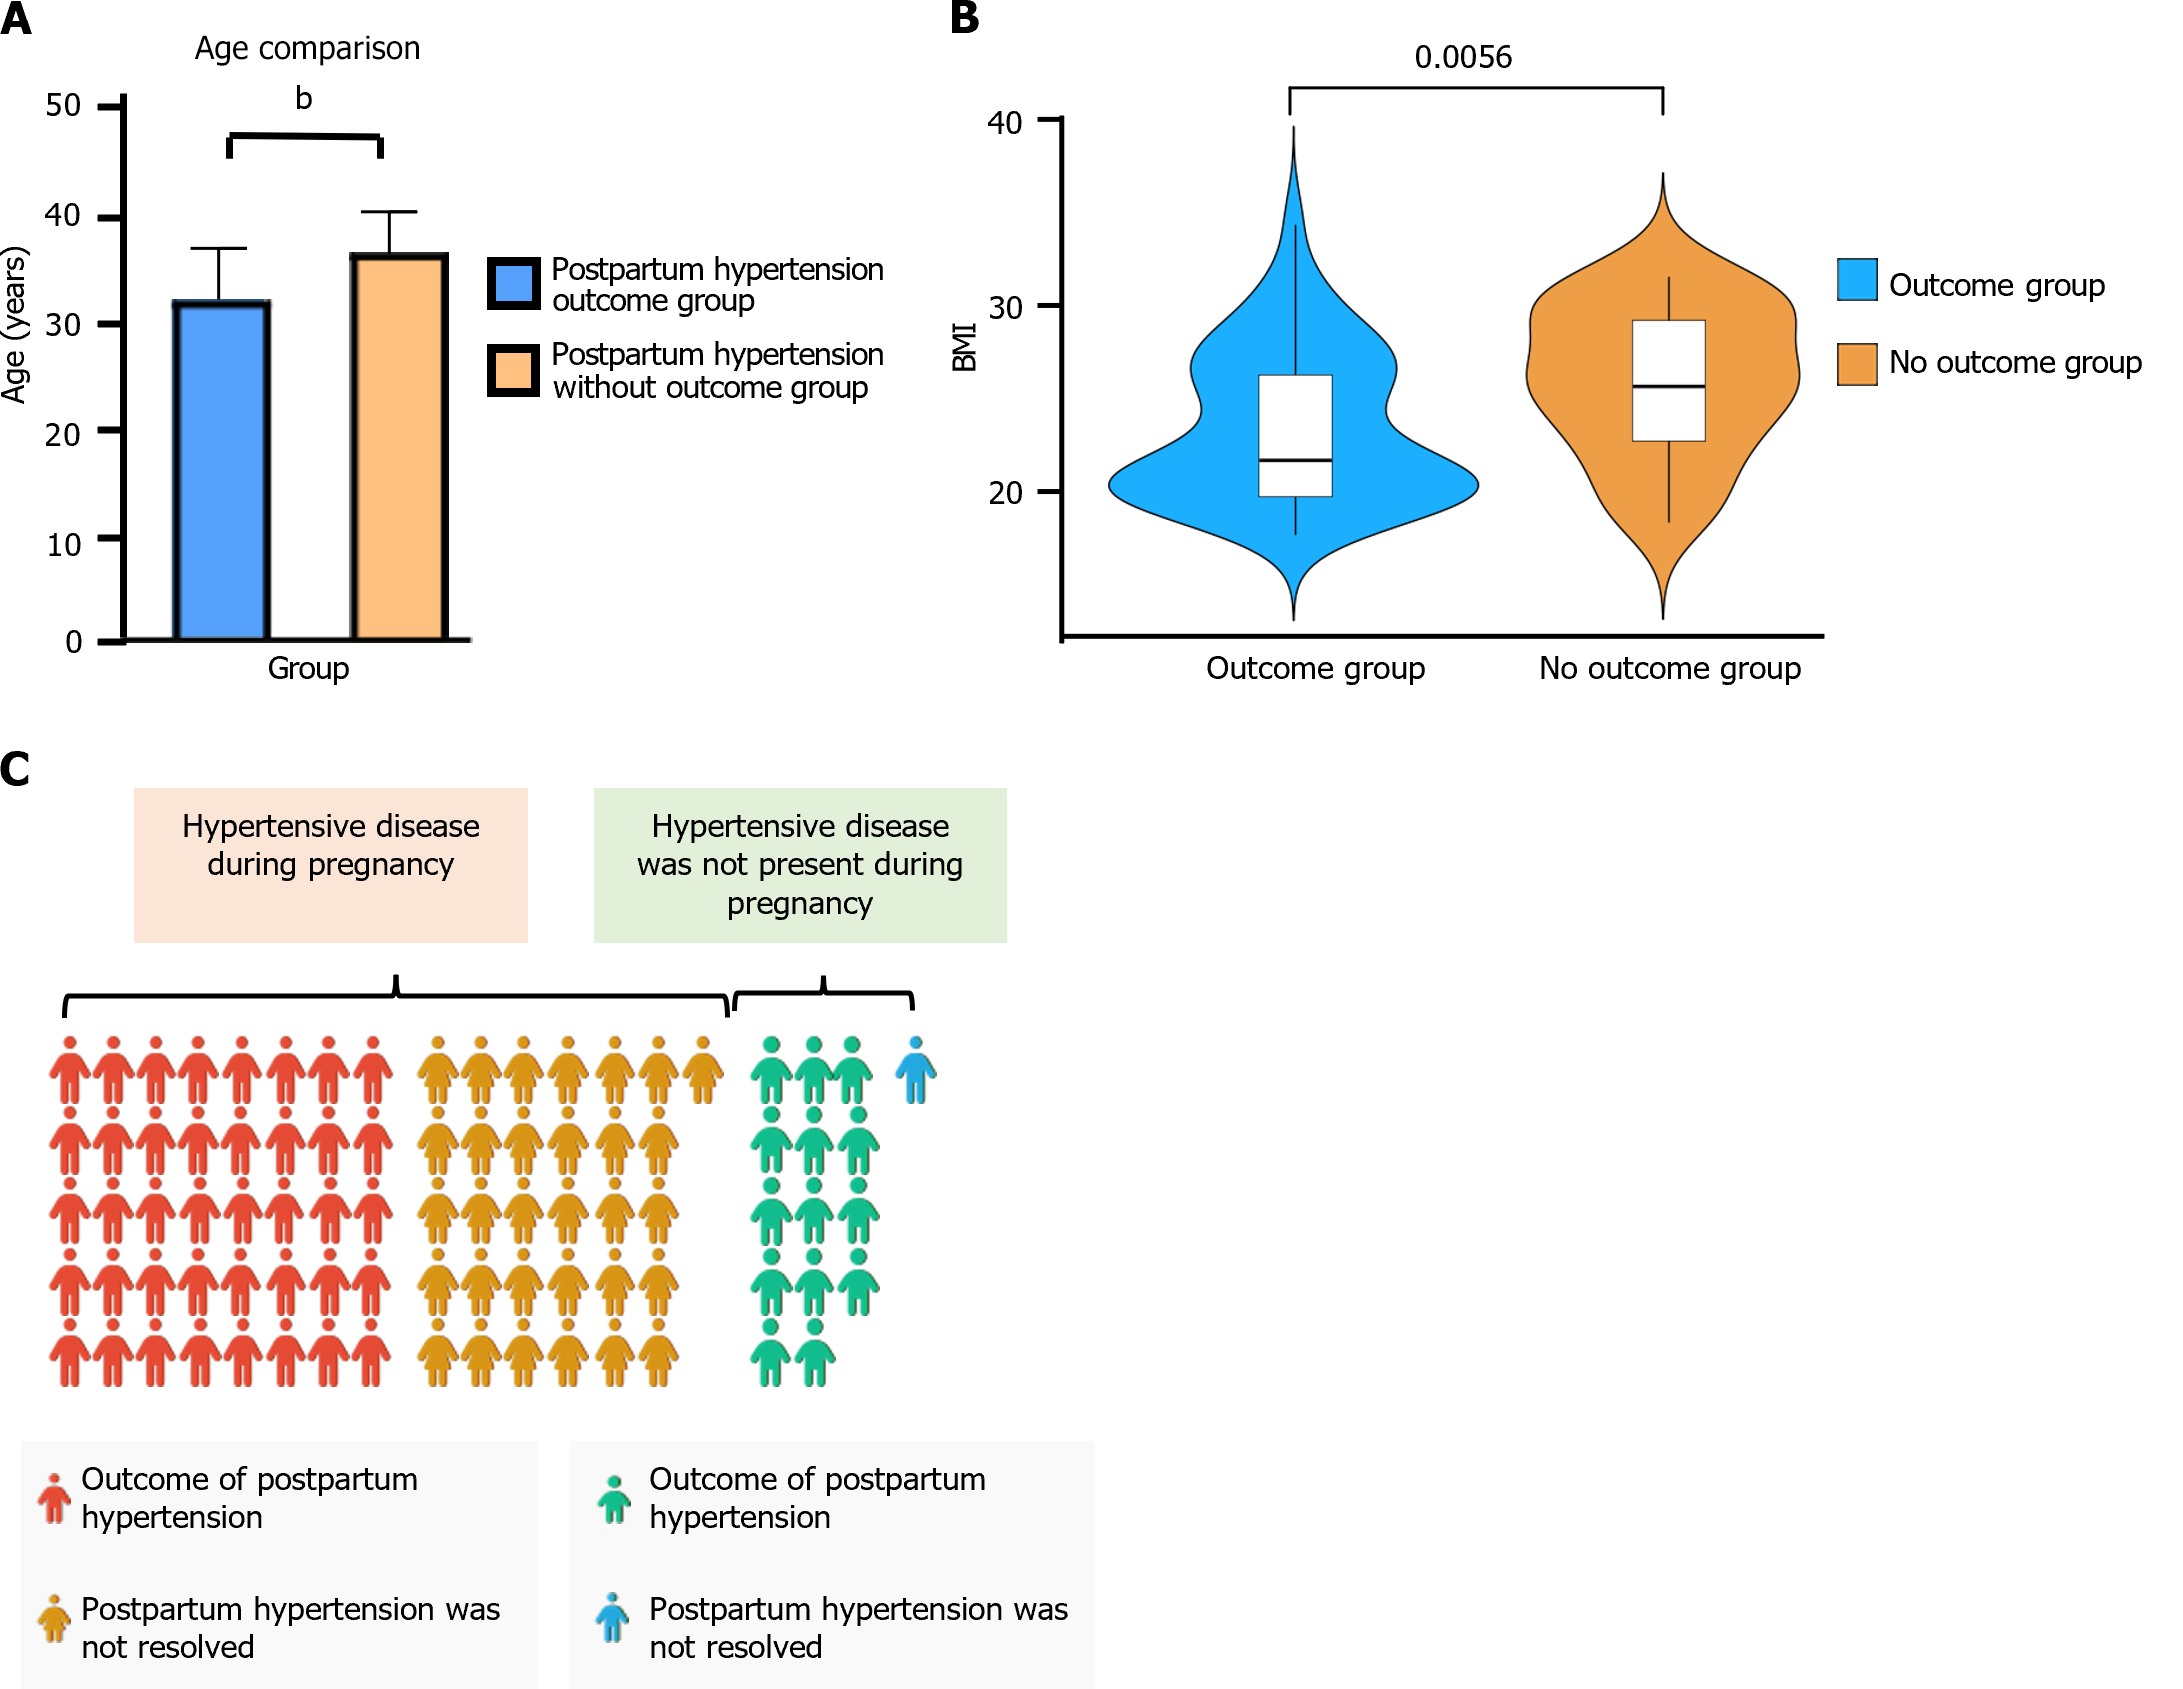
Figure 2 The two groups of the univariate analysis.
A: Age comparison between the two groups; B: Violin chart of body mass index comparison between the two groups; C: Proportion of hypertensive diseases in pregnancy between the two groups. bP < 0.001. BMI: Body mass index.
- Citation: Wu LX, Jin M, Yang J. Status, outcome, and related factors of postpartum hypertension in the Shanghai community. World J Clin Cases 2024; 12(21): 4632-4641
- URL: https://www.wjgnet.com/2307-8960/full/v12/i21/4632.htm
- DOI: https://dx.doi.org/10.12998/wjcc.v12.i21.4632


