Copyright
©The Author(s) 2024.
World J Clin Cases. Jul 26, 2024; 12(21): 4508-4517
Published online Jul 26, 2024. doi: 10.12998/wjcc.v12.i21.4508
Published online Jul 26, 2024. doi: 10.12998/wjcc.v12.i21.4508
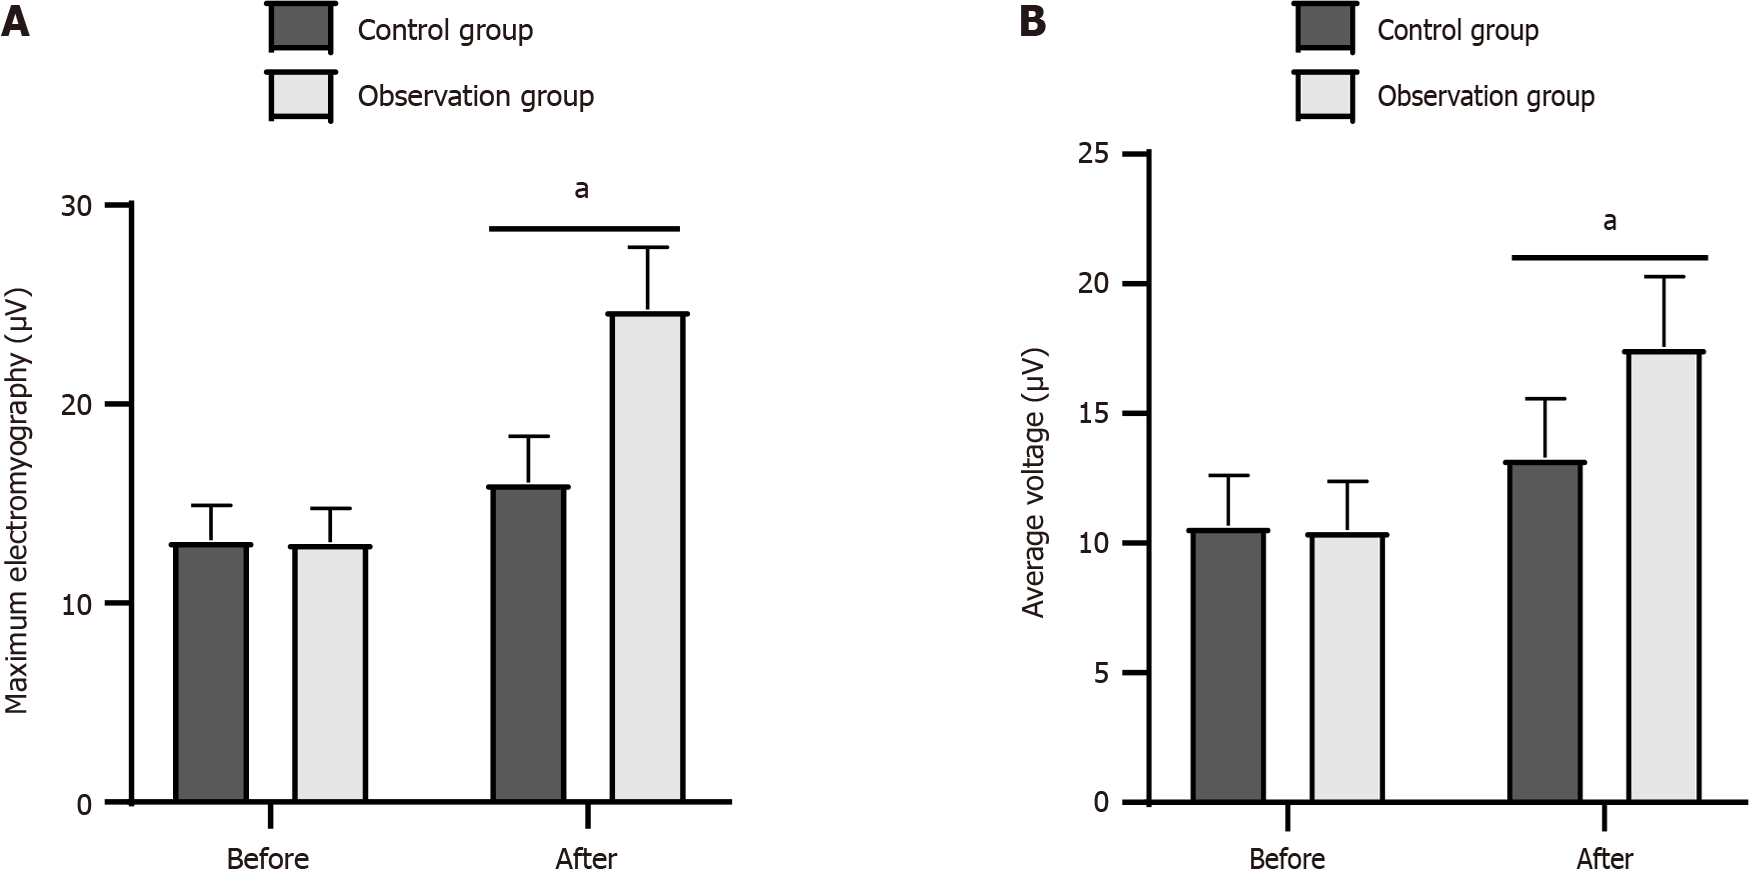
Figure 3 Pelvic floor muscle voltage in two groups.
A: Maximum electromyography analysis; B: Average muscle voltage analysis. aP < 0.05 compared with control group.
- Citation: Zhou W, Guo H. Curative effect of hydrogen peroxide combined with silver ion disinfection on pelvic floor dysfunction. World J Clin Cases 2024; 12(21): 4508-4517
- URL: https://www.wjgnet.com/2307-8960/full/v12/i21/4508.htm
- DOI: https://dx.doi.org/10.12998/wjcc.v12.i21.4508


