Copyright
©The Author(s) 2024.
World J Clin Cases. Jul 6, 2024; 12(19): 3767-3775
Published online Jul 6, 2024. doi: 10.12998/wjcc.v12.i19.3767
Published online Jul 6, 2024. doi: 10.12998/wjcc.v12.i19.3767
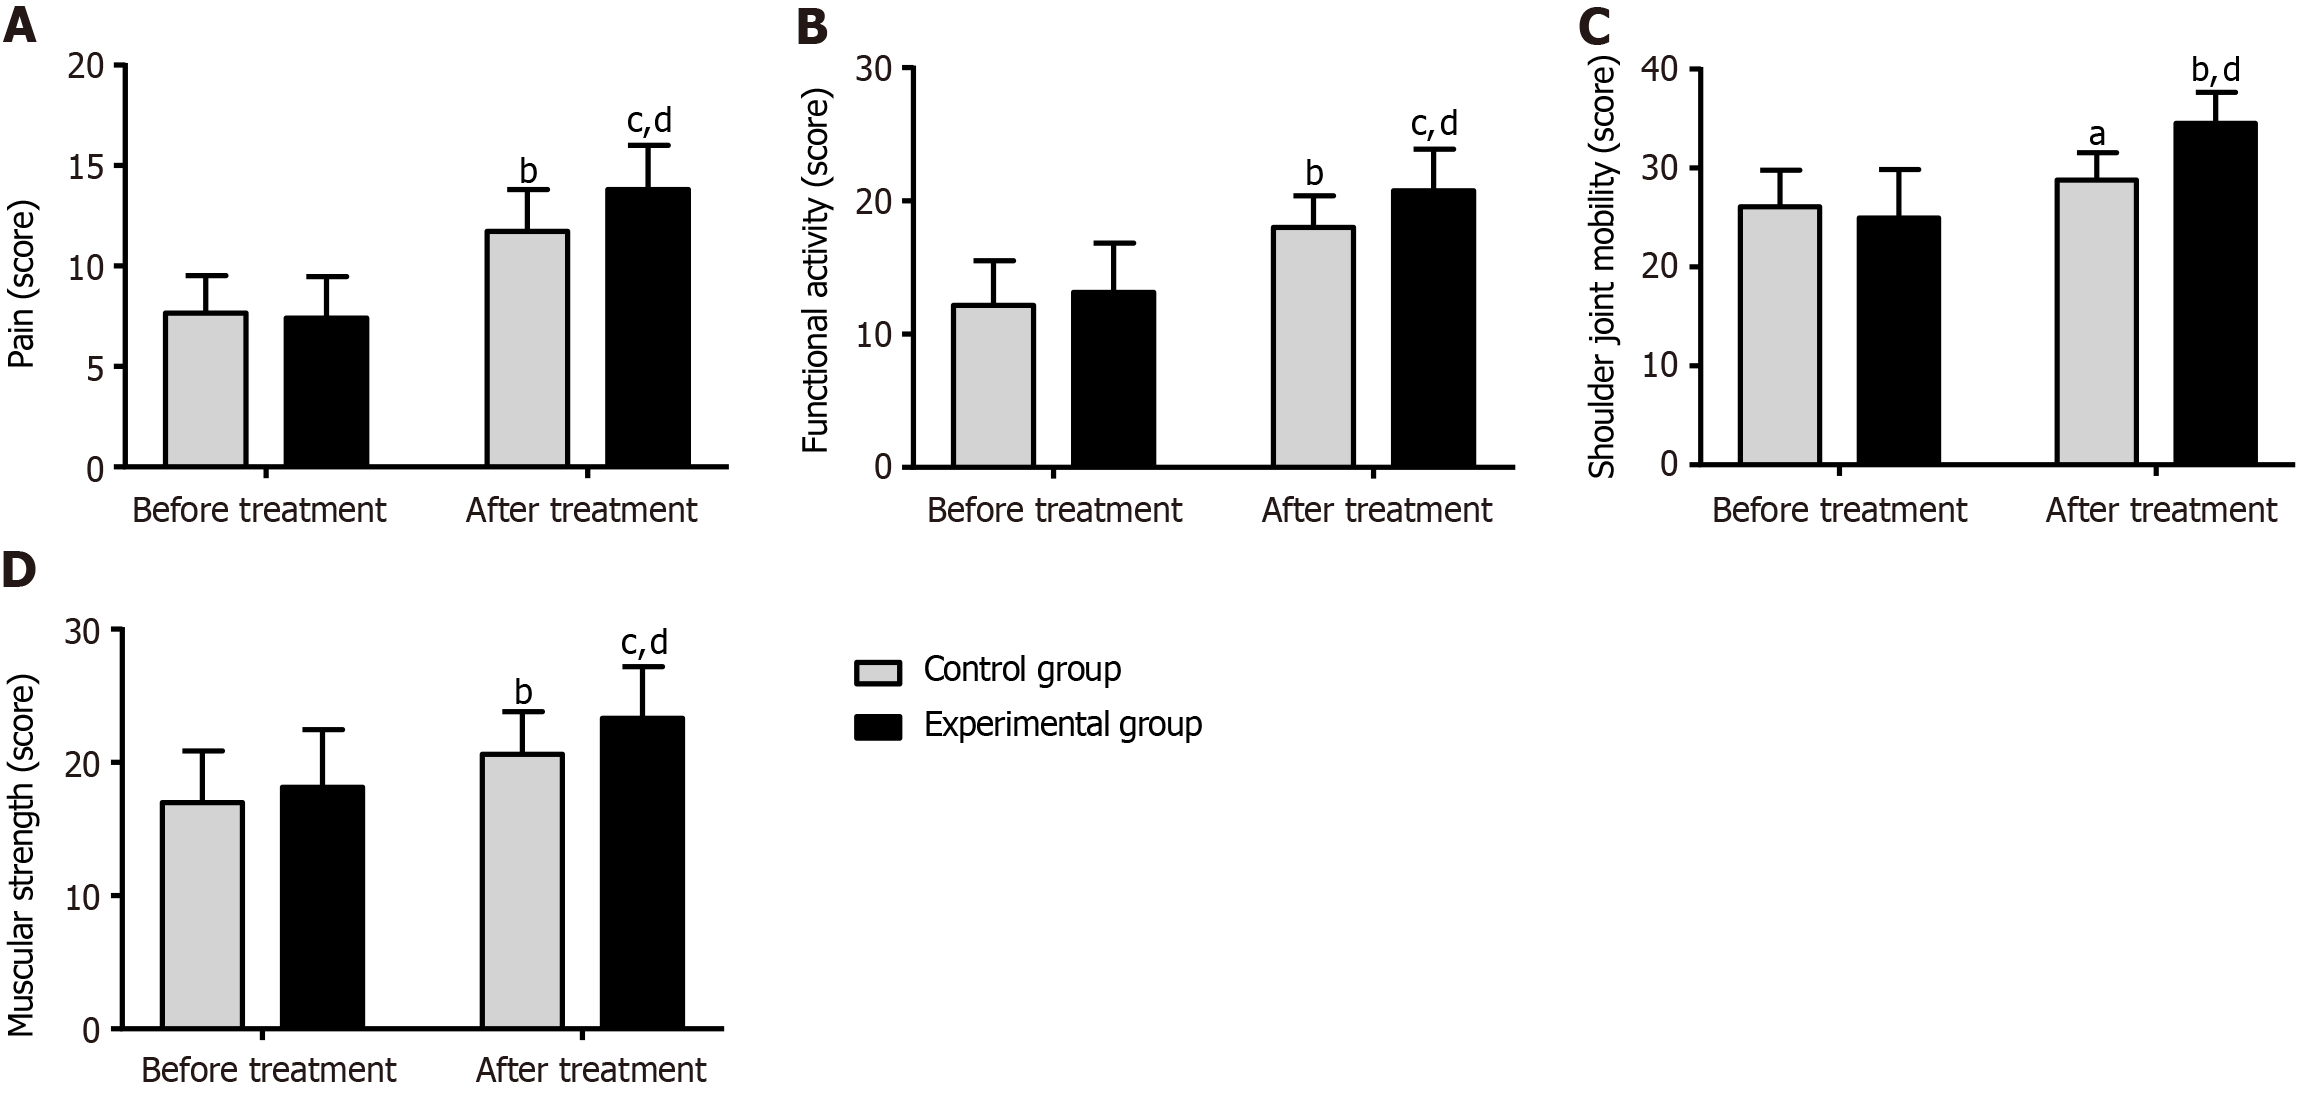
Figure 1 Comparative evaluation of Constant-Murley Score.
A: The experimental group showed a significantly elevated pain score after treatment, higher than the pretreatment level and that of the control group; B: The experimental group had an obviously increased functional activity score after treatment, higher than the pretreatment level and that of the control group; C: The experimental group showed a statistically elevated shoulder joint mobility score after treatment, higher than the pretreatment level and that of the control group; D: The experimental group had a significantly elevated muscular strength score after treatment, higher than the pretreatment level and that of the control group. aP < 0.05 vs before treatment; bP < 0.01 vs before treatment; cP < 0.001 vs before treatment; dP < 0.001 vs control group.
- Citation: Cao DP, Yin L, Wang YF, Liu BL. Application of multidisciplinary team-based integrated traditional Chinese medicine and Western medicine in rotator cuff injury patients undergoing arthroscopic surgery. World J Clin Cases 2024; 12(19): 3767-3775
- URL: https://www.wjgnet.com/2307-8960/full/v12/i19/3767.htm
- DOI: https://dx.doi.org/10.12998/wjcc.v12.i19.3767


