Copyright
©The Author(s) 2024.
World J Clin Cases. Jun 16, 2024; 12(17): 3105-3122
Published online Jun 16, 2024. doi: 10.12998/wjcc.v12.i17.3105
Published online Jun 16, 2024. doi: 10.12998/wjcc.v12.i17.3105
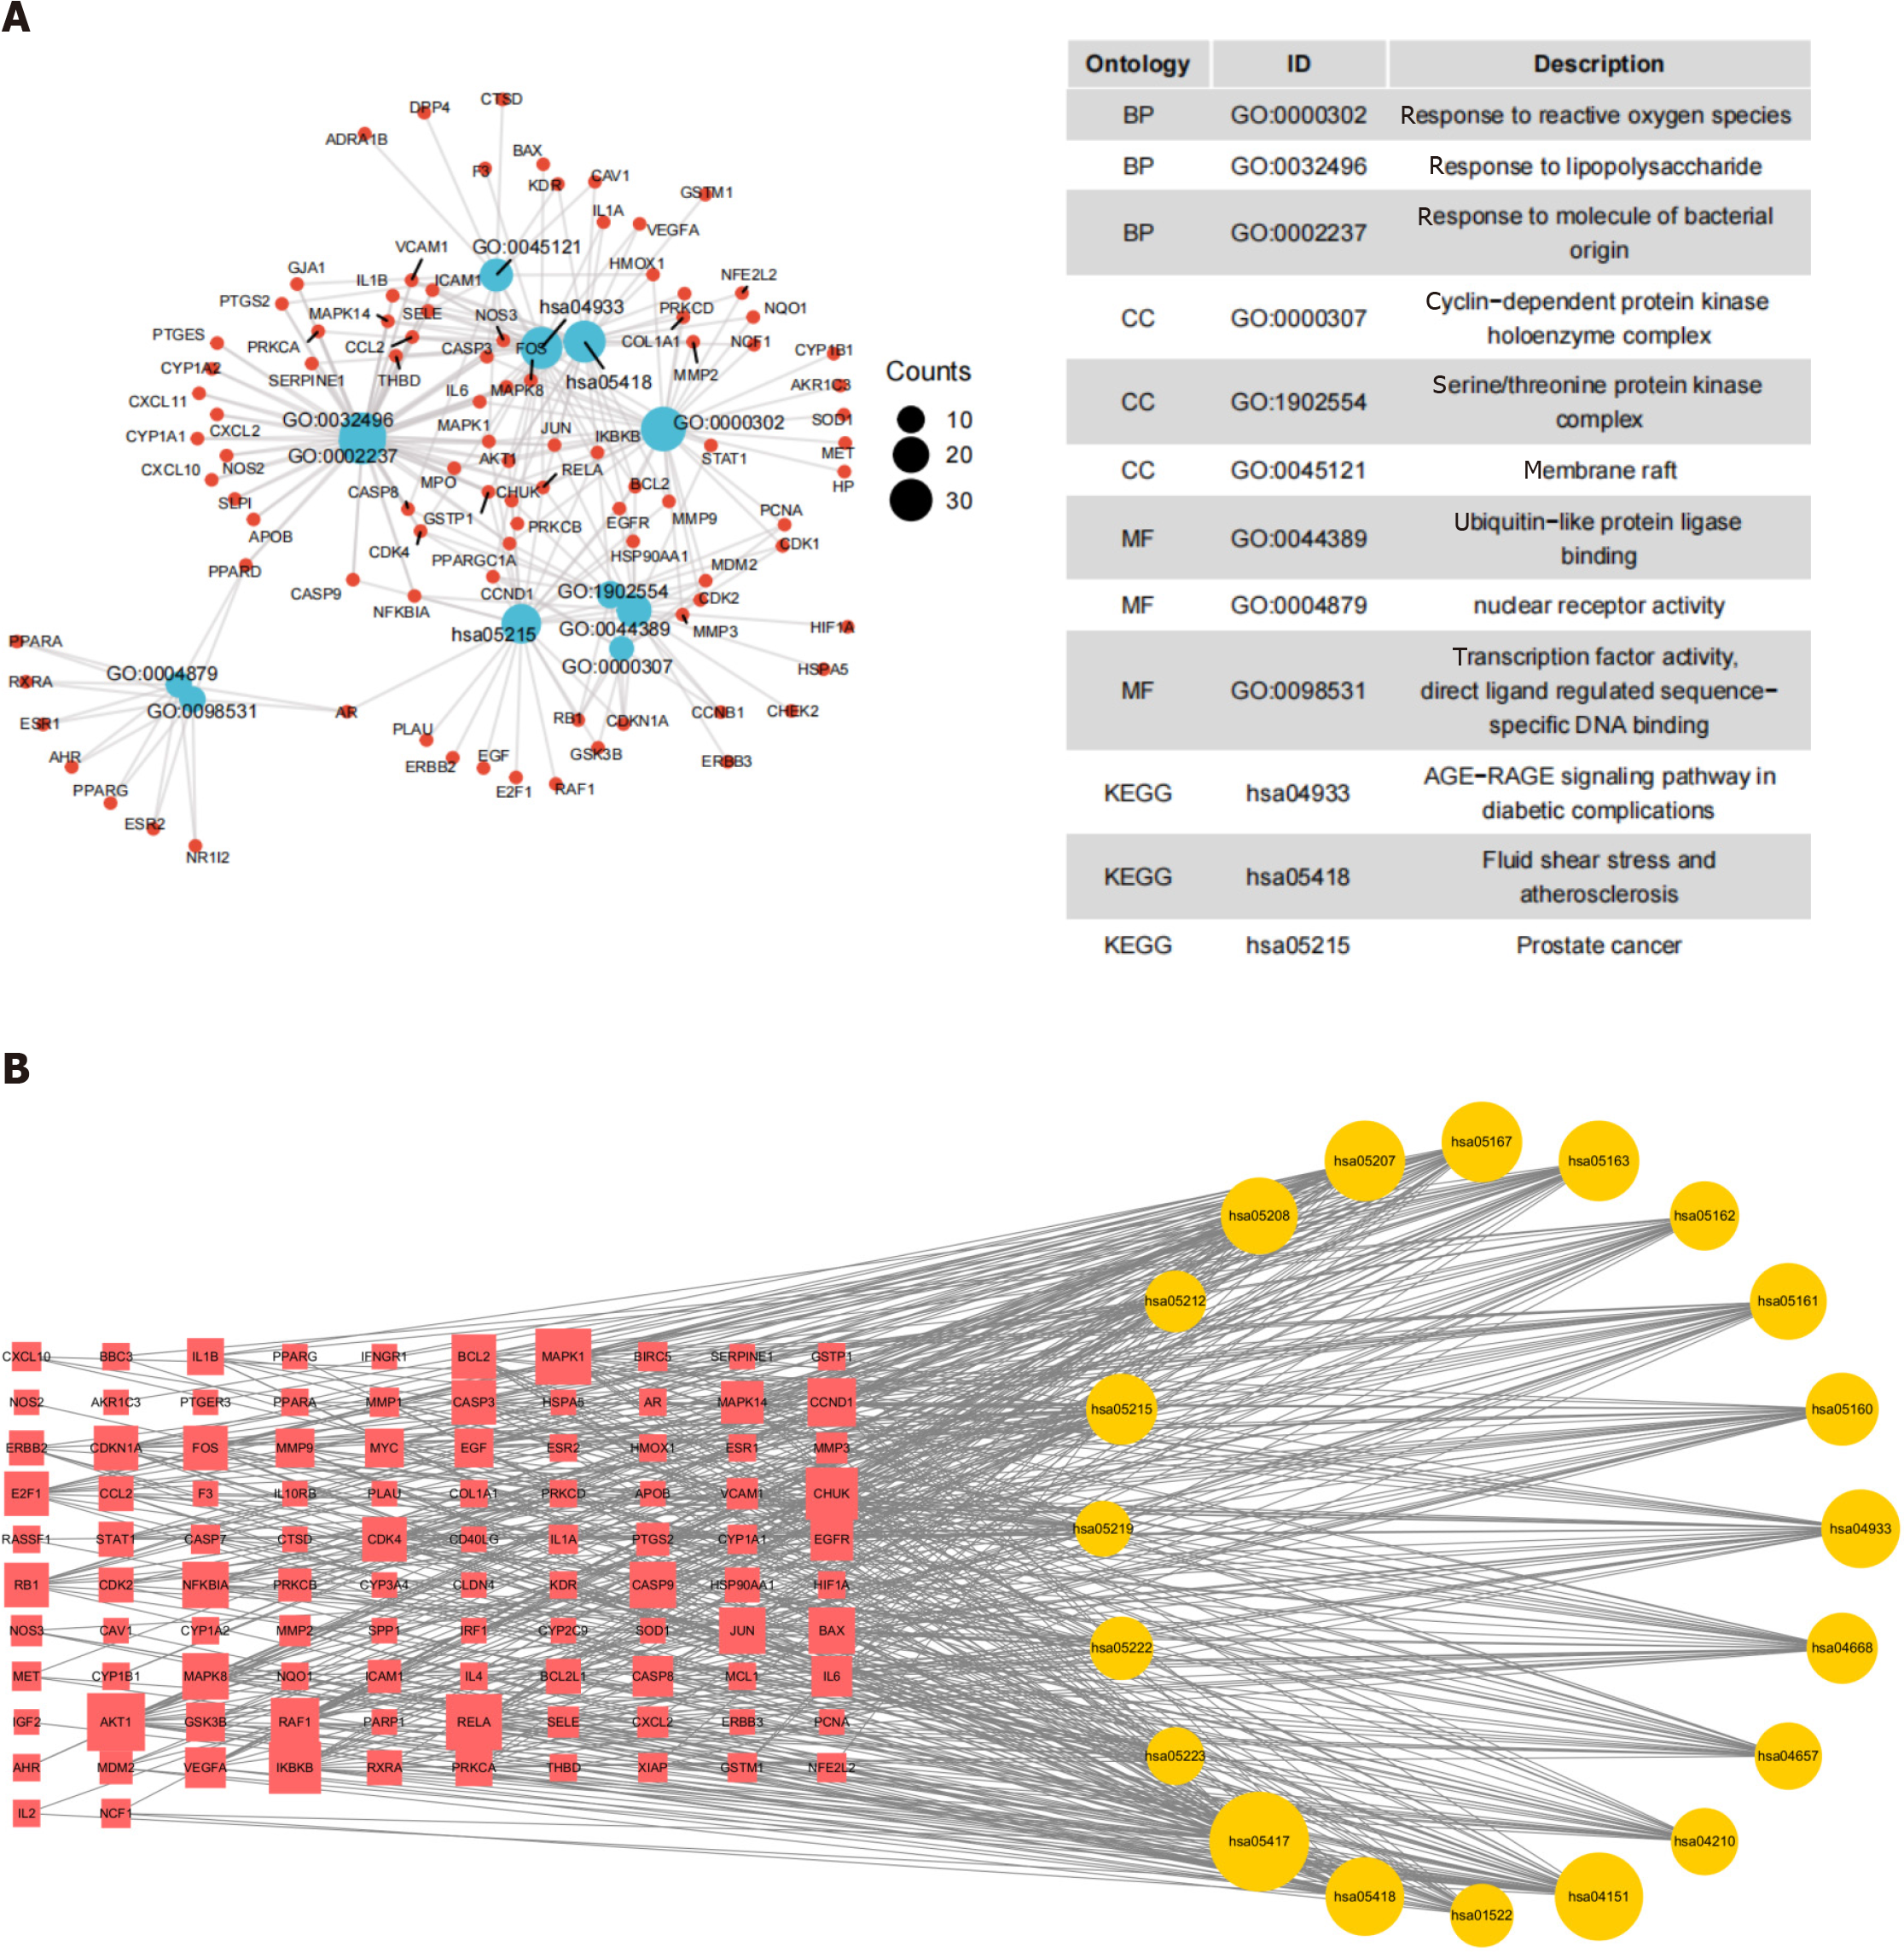
Figure 9 Visualization of Gene Ontology and Kyoto Encyclopedia of Genes and Genomes enrichment analysis.
A: Visualization of Gene Ontology classification annotation analysis; B: Visualization of Kyoto Encyclopedia of Genes and Genomes pathway enrichment analysis. A node between two lines symbolizes interaction, with larger nodes indicating stronger relationships.
- Citation: Huang XL, Wu LN, Huang Q, Zhou Y, Qing L, Xiong F, Dong HP, Zhou TM, Wang KL, Liu J. Unraveling the mechanism of malancao in treating ulcerative colitis: A multi-omics approach. World J Clin Cases 2024; 12(17): 3105-3122
- URL: https://www.wjgnet.com/2307-8960/full/v12/i17/3105.htm
- DOI: https://dx.doi.org/10.12998/wjcc.v12.i17.3105


