Copyright
©The Author(s) 2024.
World J Clin Cases. Jun 16, 2024; 12(17): 3094-3104
Published online Jun 16, 2024. doi: 10.12998/wjcc.v12.i17.3094
Published online Jun 16, 2024. doi: 10.12998/wjcc.v12.i17.3094
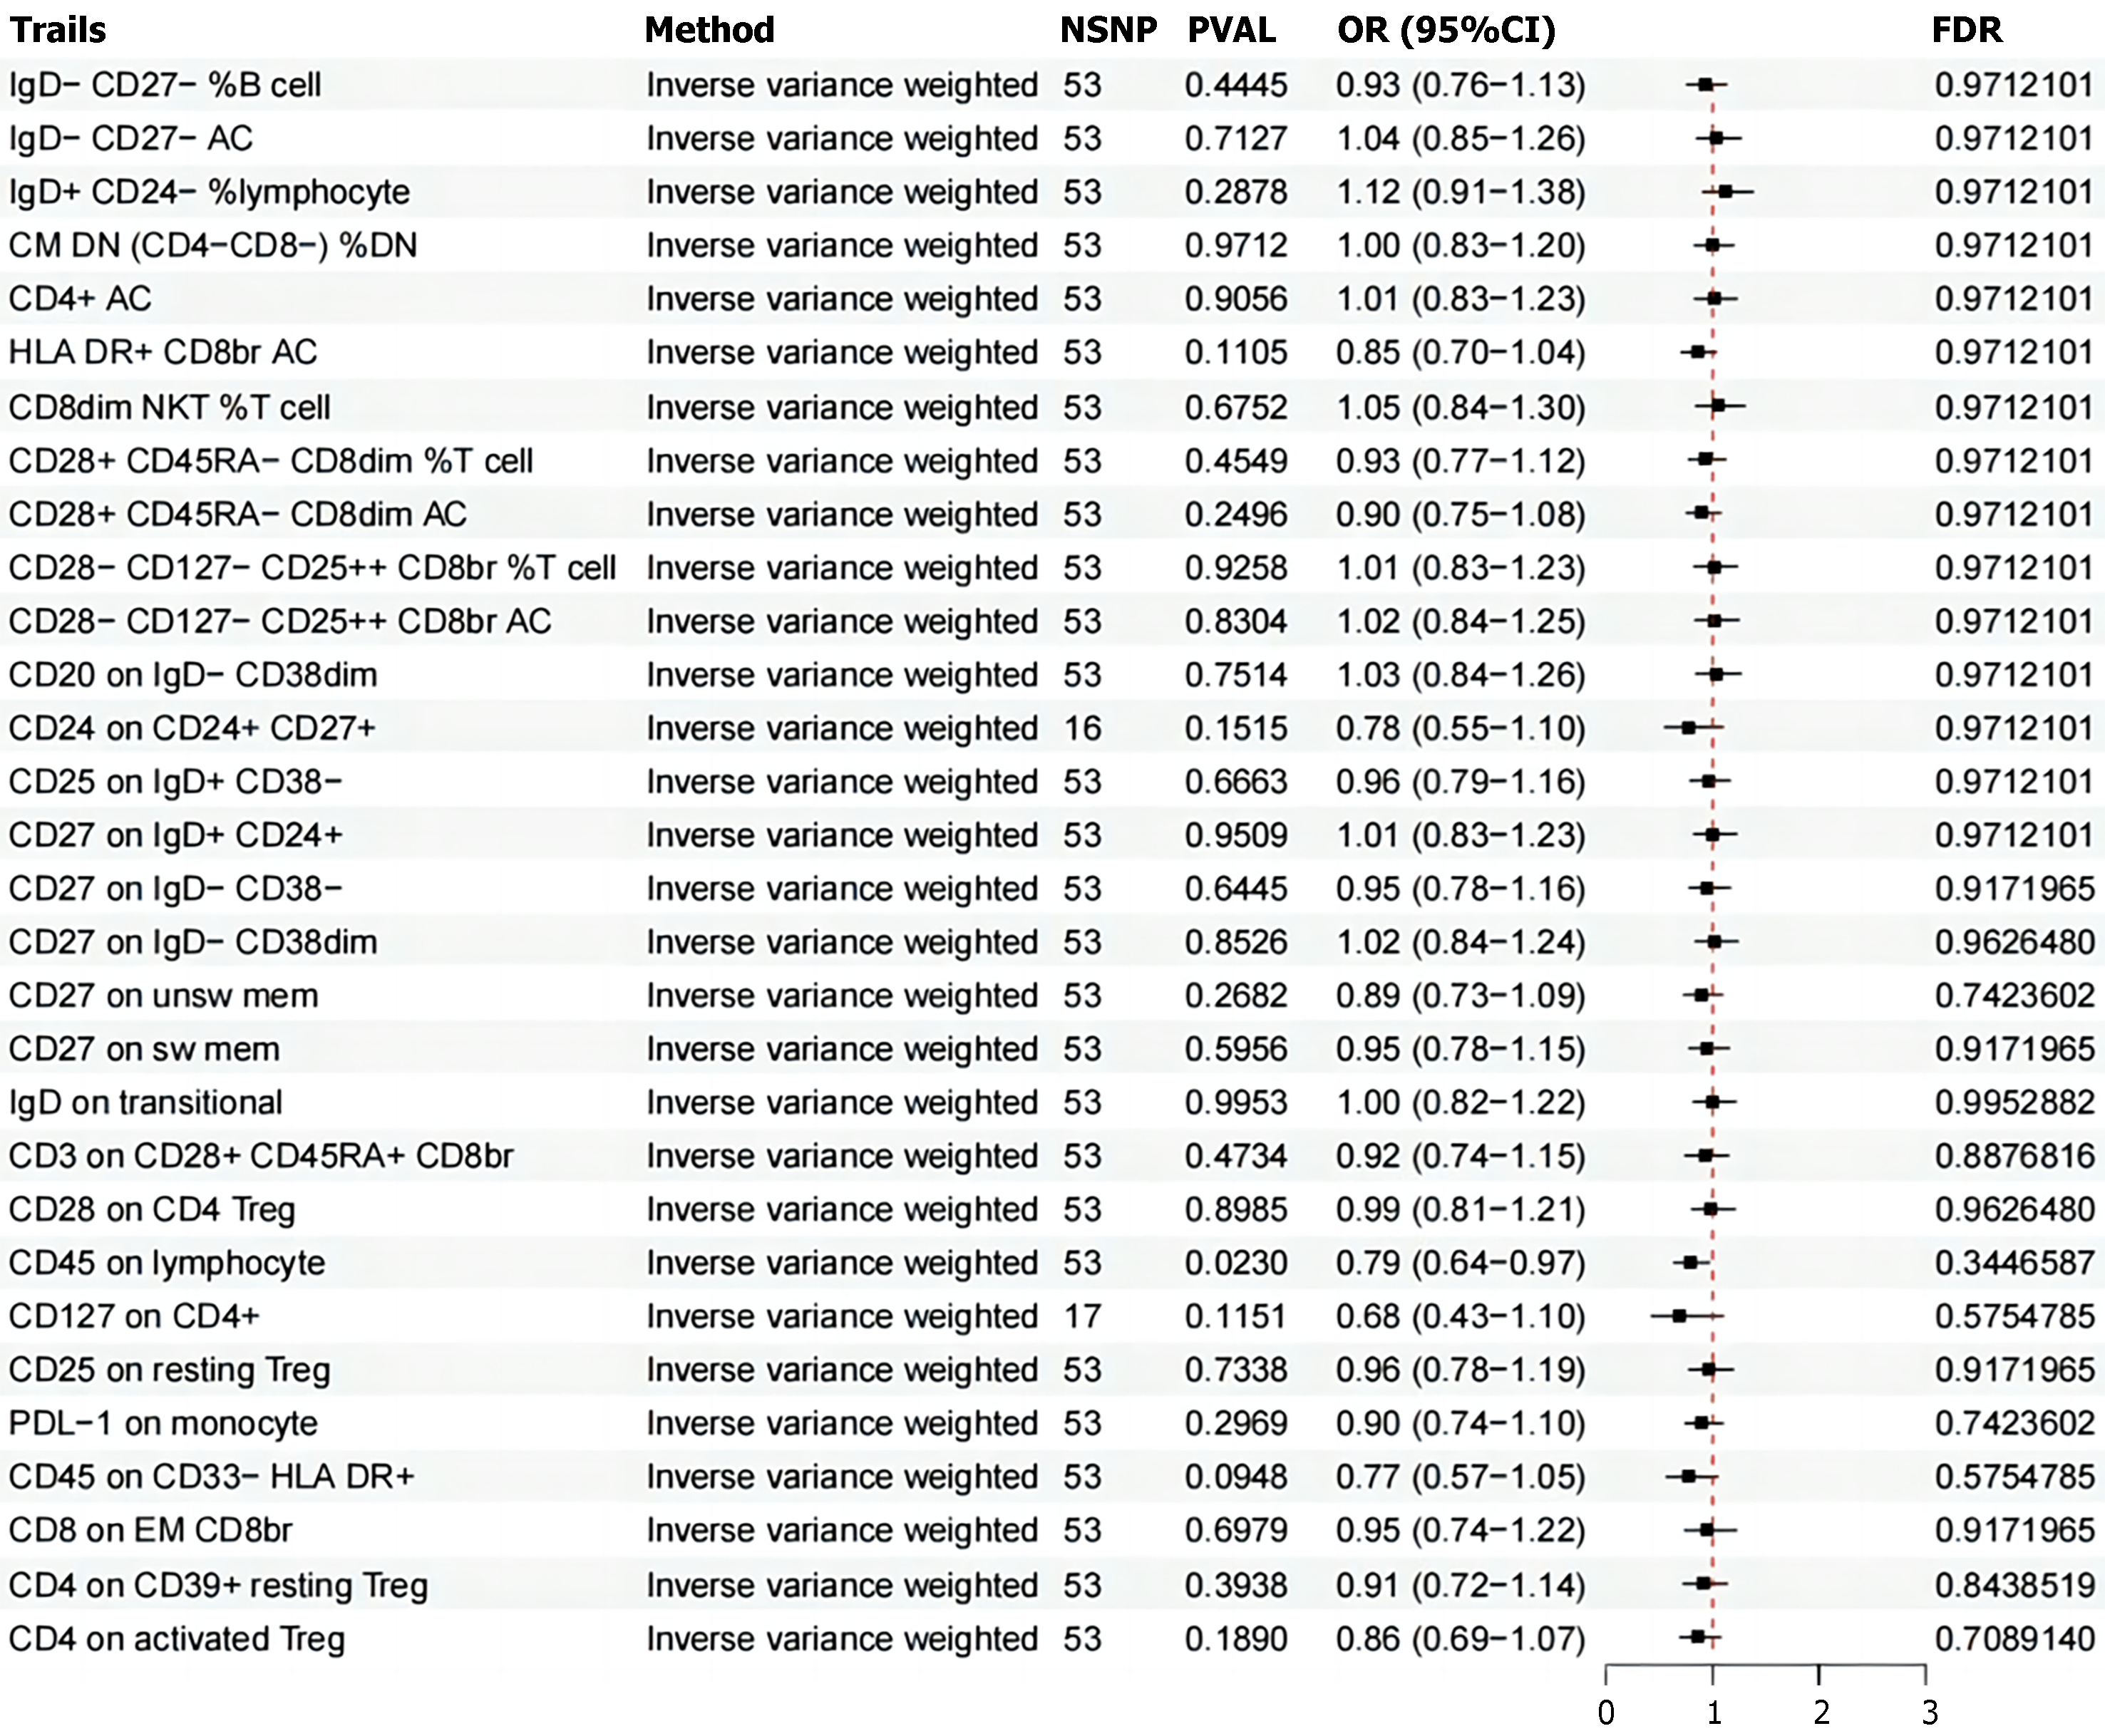
Figure 1 The forest plot presents the causal associations between irritable bowel syndrome and diverse immune cell phenotypes.
Inverse variance weighting indicates Inverse variance weighting, and CI denotes the confidence interval. Trails: Immunological phenotypes; Methods: Inverse variance weighting; NSNP: Number of single nucleotide polymorphisms; PVAL: Statistical P value; OR (95%CI): Represents the odds ratio and its 95% confidence interval; FDR: False discovery rate.
- Citation: Chai WH, Ma Y, Li JJ, Guo F, Wu YZ, Liu JW. Immune cell signatures and causal association with irritable bowel syndrome: A mendelian randomization study. World J Clin Cases 2024; 12(17): 3094-3104
- URL: https://www.wjgnet.com/2307-8960/full/v12/i17/3094.htm
- DOI: https://dx.doi.org/10.12998/wjcc.v12.i17.3094


