Copyright
©The Author(s) 2024.
World J Clin Cases. Jun 16, 2024; 12(17): 3027-3034
Published online Jun 16, 2024. doi: 10.12998/wjcc.v12.i17.3027
Published online Jun 16, 2024. doi: 10.12998/wjcc.v12.i17.3027
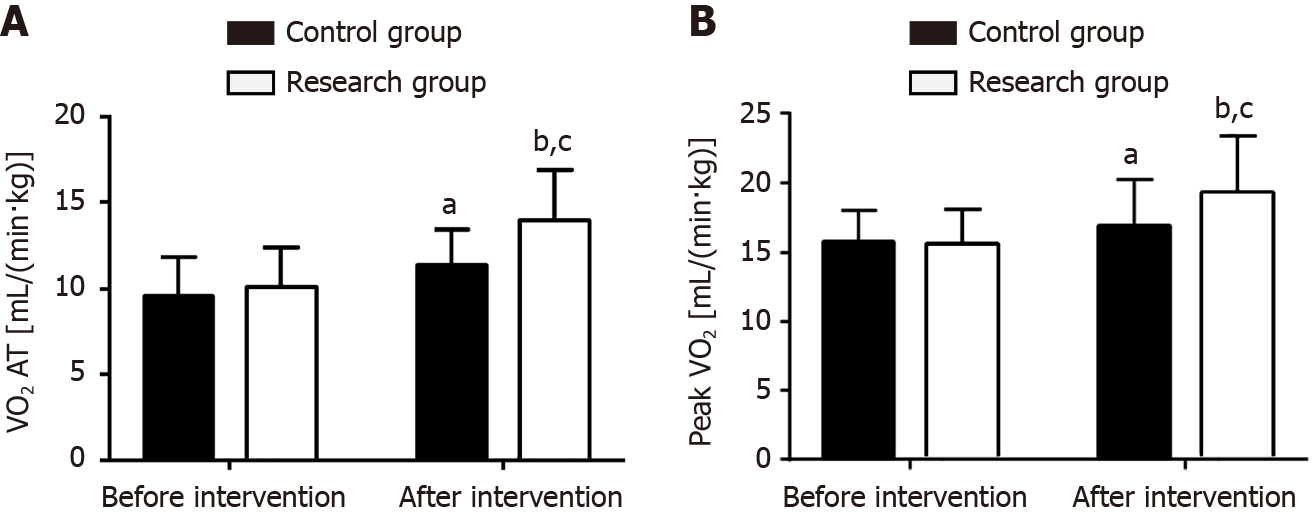
Figure 1 Comparative analysis of anaerobic threshold and peak exercise before and after intervention.
A: Oxygen consumption at the anaerobic threshold (VO2 AT) before and after intervention; B: Oxygen consumption at peak exercise (peak VO2) before and after intervention. aP < 0.05 vs before intervention. bP < 0.01 vs before intervention. cP < 0.05 vs control group. VO2 AT: Oxygen consumption at the anaerobic threshold; Peak VO2: Oxygen consumption at peak exercise.
- Citation: Xu JJ, Dai J, Xie QH, Du PC, Li C, Zhou H. Effect of Luhong formula on the cardiac rehabilitation of patients with chronic heart failure. World J Clin Cases 2024; 12(17): 3027-3034
- URL: https://www.wjgnet.com/2307-8960/full/v12/i17/3027.htm
- DOI: https://dx.doi.org/10.12998/wjcc.v12.i17.3027


