Copyright
©The Author(s) 2024.
World J Clin Cases. Jun 6, 2024; 12(16): 2713-2721
Published online Jun 6, 2024. doi: 10.12998/wjcc.v12.i16.2713
Published online Jun 6, 2024. doi: 10.12998/wjcc.v12.i16.2713
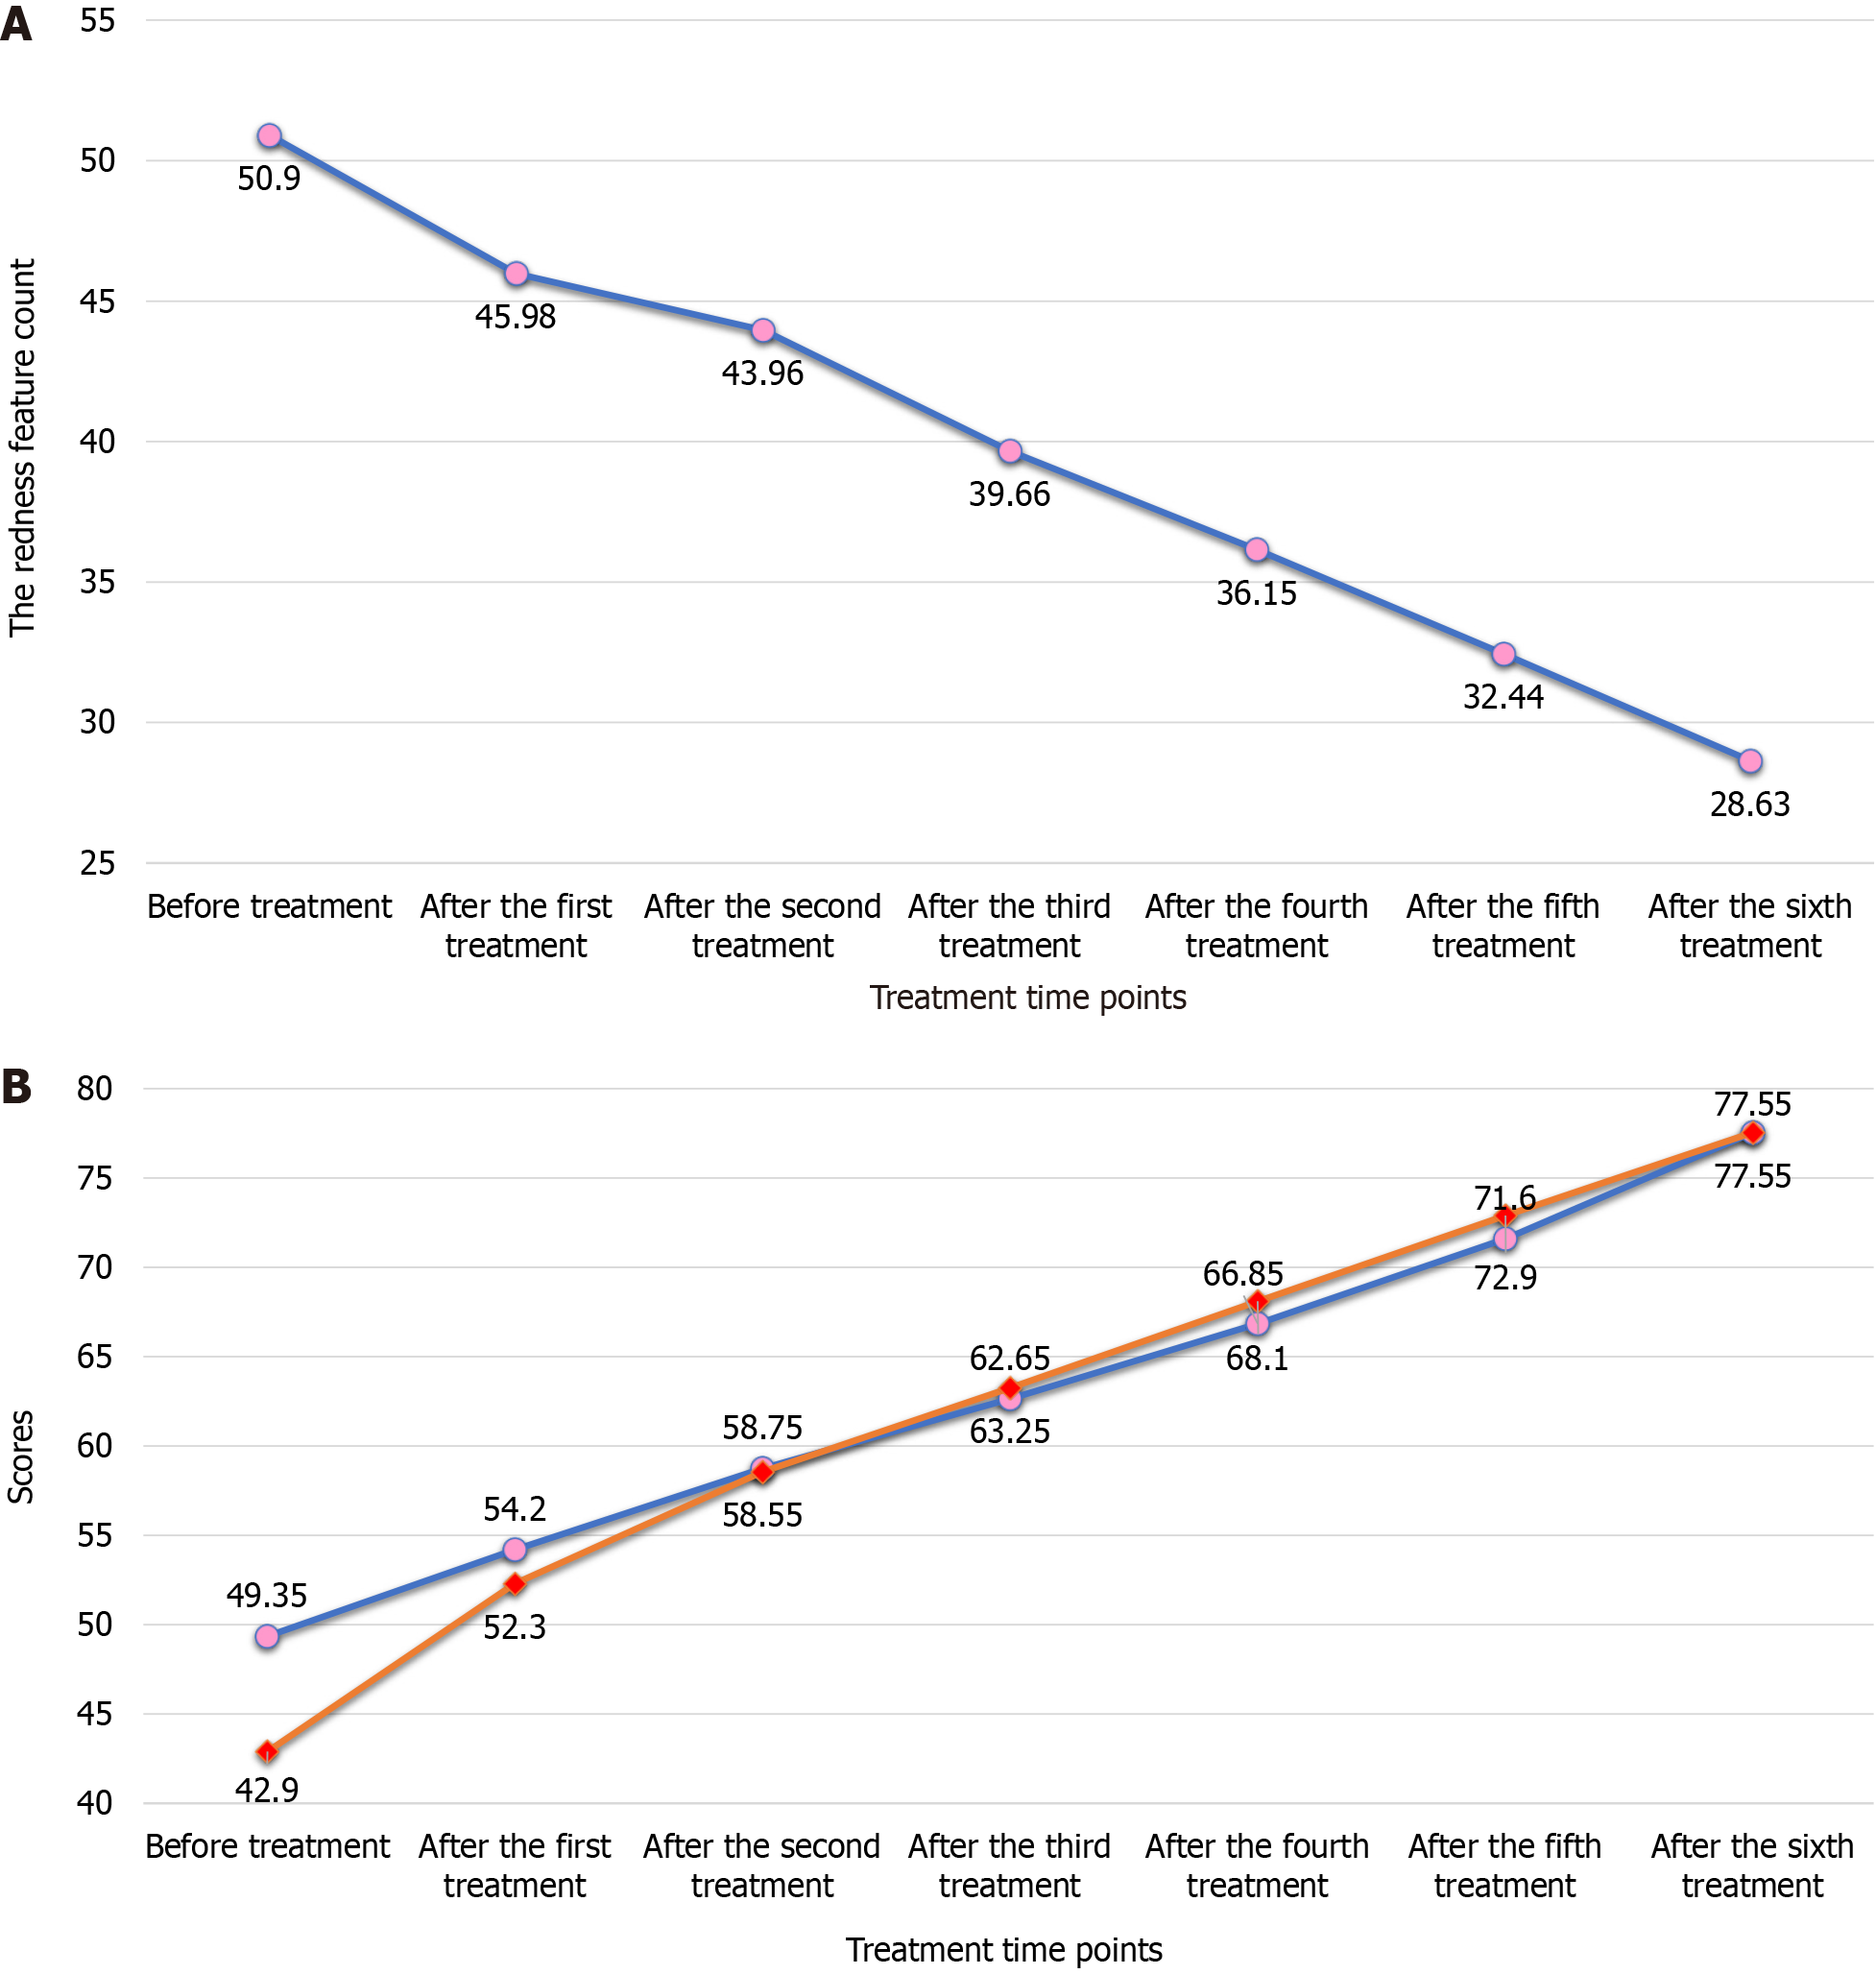
Figure 3 Redness feature counts and Face-Q satisfaction scores before and after treatment.
A: Trend of the red area feature count before and after treatment. The graph shows the trend in the mean counts of redness features before and after treatment for the 20 subjects with a blue line, while solid dots are used to represent the mean counts at each treatment time point; B: Trends of Face-Q facial appearance satisfaction and skin satisfaction scores before and after treatment. The graph shows the trend of the Face-Q Satisfaction with Facial Appearance mean scores of 20 subjects before and after treatment in blue, and the trend of the Face-Q Satisfaction with Skin mean scores of 20 subjects before and after treatment in orange. The solid dots indicate the mean scores at each treatment time point.
- Citation: Yang B, He A, Bu BB, Zhuo G, Zhou QZ, He JH, Liu L, Huang WL, Zhao X. Clinical efficacy of intradermal type I collagen injections in treating skin photoaging in patients from high-altitude areas. World J Clin Cases 2024; 12(16): 2713-2721
- URL: https://www.wjgnet.com/2307-8960/full/v12/i16/2713.htm
- DOI: https://dx.doi.org/10.12998/wjcc.v12.i16.2713


