Copyright
©The Author(s) 2024.
World J Clin Cases. May 26, 2024; 12(15): 2606-2613
Published online May 26, 2024. doi: 10.12998/wjcc.v12.i15.2606
Published online May 26, 2024. doi: 10.12998/wjcc.v12.i15.2606
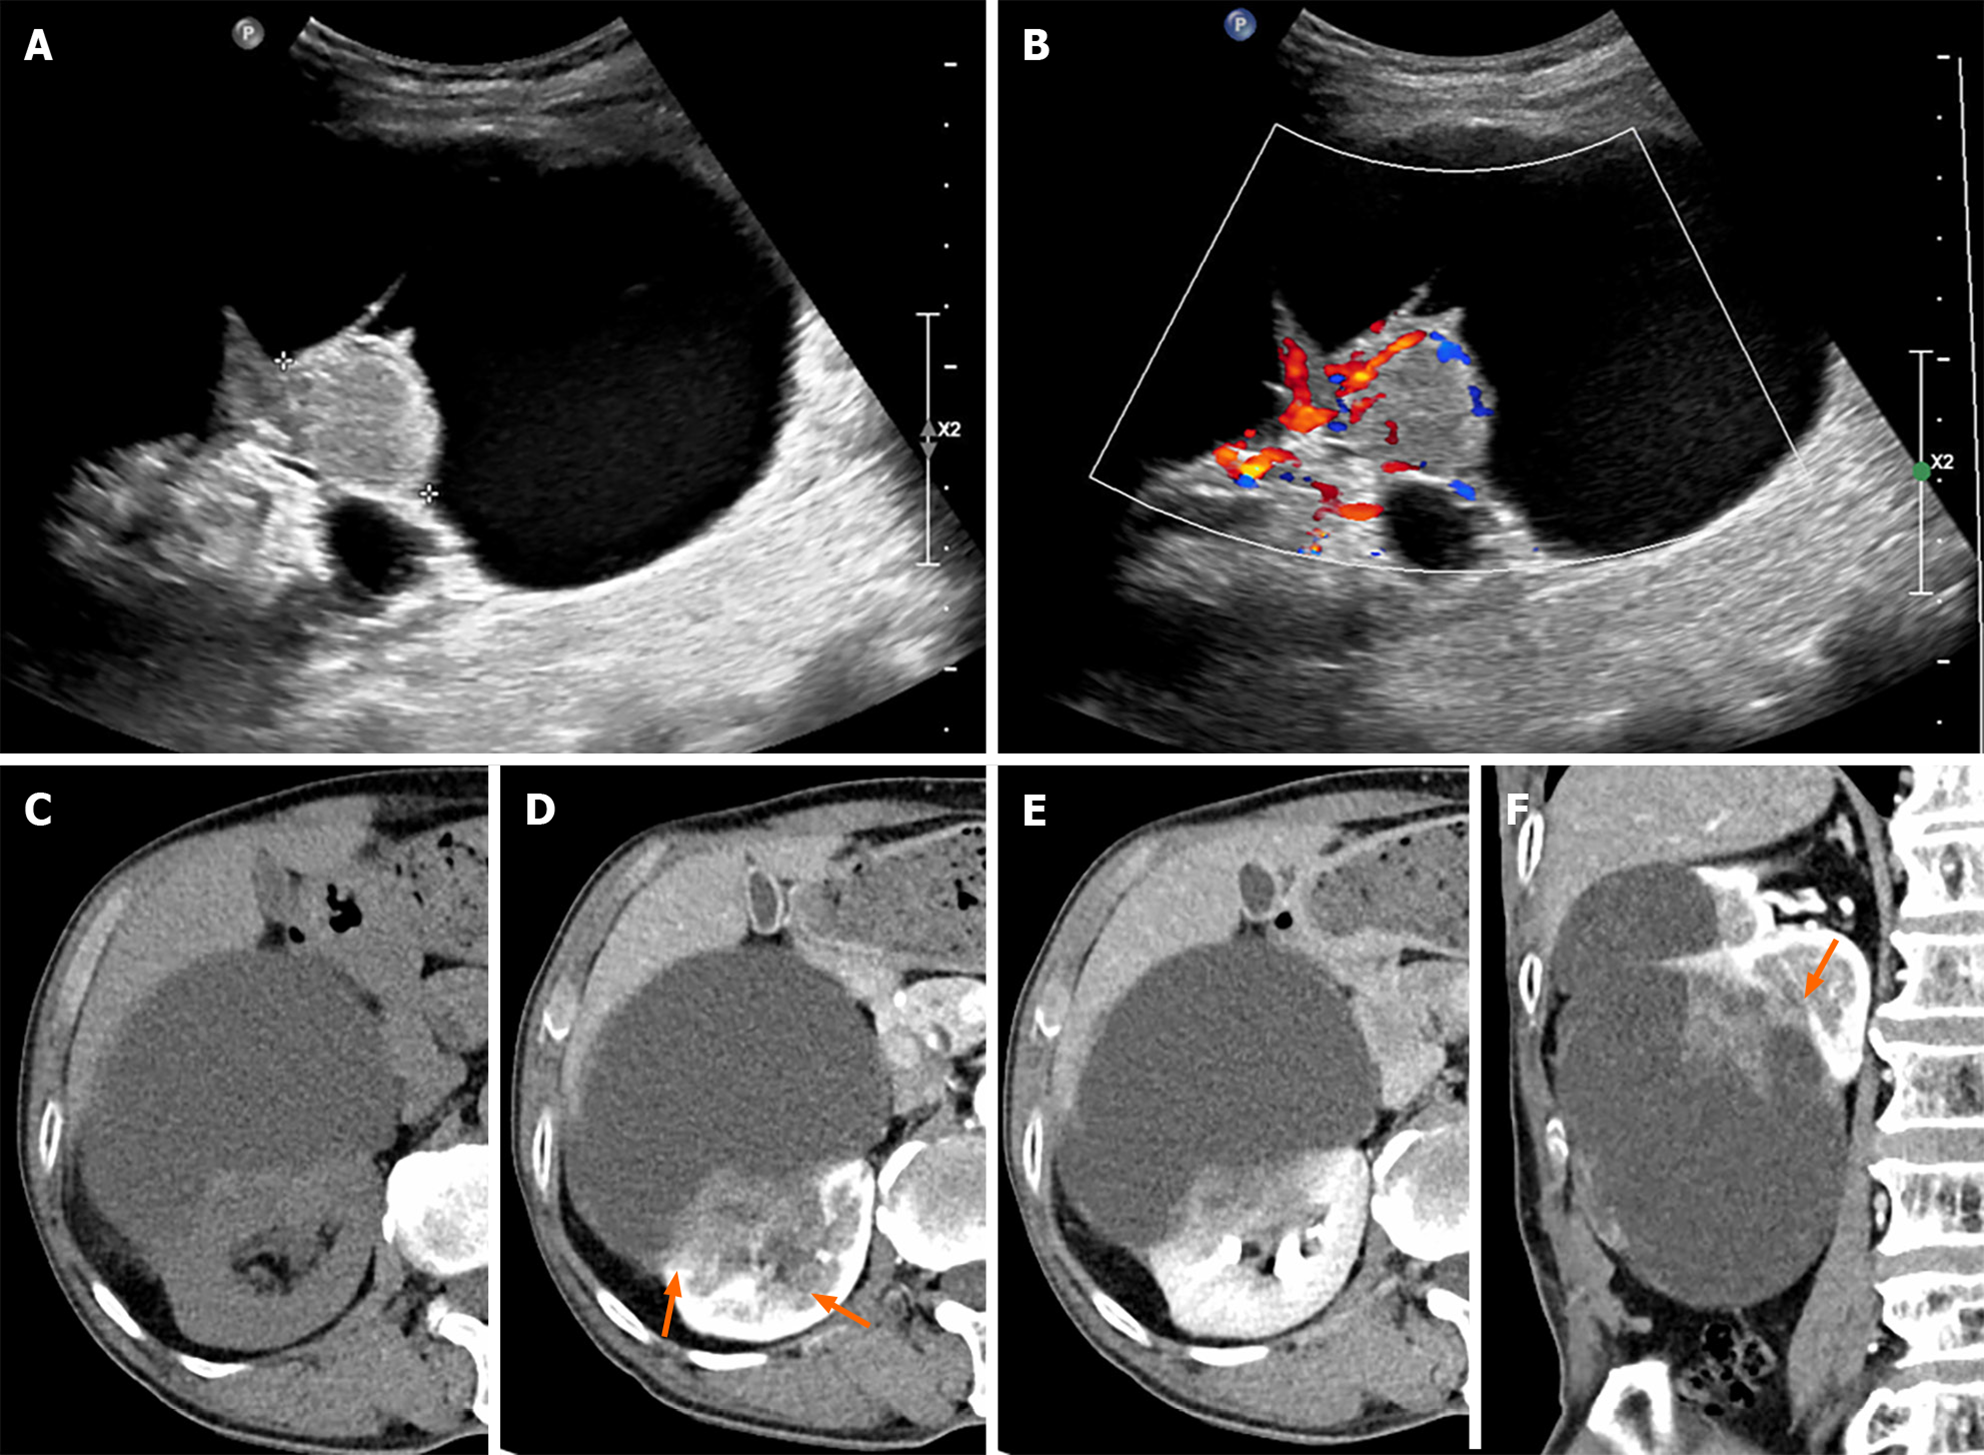
Figure 1 Initial ultrasound and abdominal computed tomography scan of the right kidney.
A: An 11 cm × 10 cm cystic lesion is noted in the right kidney with a 3.2 cm solid component on ultrasound B-mode; B: Increased vascularity is seen in the solid component on color doppler mode; C: A pre-contrast phase axial computed tomography (CT) shows a cystic lesion with a mass at the posterior-lateral aspect of the right kidney interpolar region-lower pole. A subtle high-attenuation area is seen in the cystic lesion, suggesting hemorrhage; D and E: Corticomedullary and excretory phase axial CT shows progressive enhancement of the mass (pre-contrast phase: 40 HU, corticomedullary phase: 70 HU, excretory phase: 80 HU) and a suspiciously indistinct margin (orange arrows) and invasion of the sinus; F: Corticomedullary phase coronal CT scan shows an irregular enhancing mass in a lesion with indistinct margins (orange arrow).
- Citation: Kim S, Park J, Ko YH, Kwon HJ. Primary Ewing sarcoma of the kidney mimicking cystic papillary renal cell carcinoma in an older patient: A case report. World J Clin Cases 2024; 12(15): 2606-2613
- URL: https://www.wjgnet.com/2307-8960/full/v12/i15/2606.htm
- DOI: https://dx.doi.org/10.12998/wjcc.v12.i15.2606


