Copyright
©The Author(s) 2024.
World J Clin Cases. Apr 26, 2024; 12(12): 2050-2055
Published online Apr 26, 2024. doi: 10.12998/wjcc.v12.i12.2050
Published online Apr 26, 2024. doi: 10.12998/wjcc.v12.i12.2050
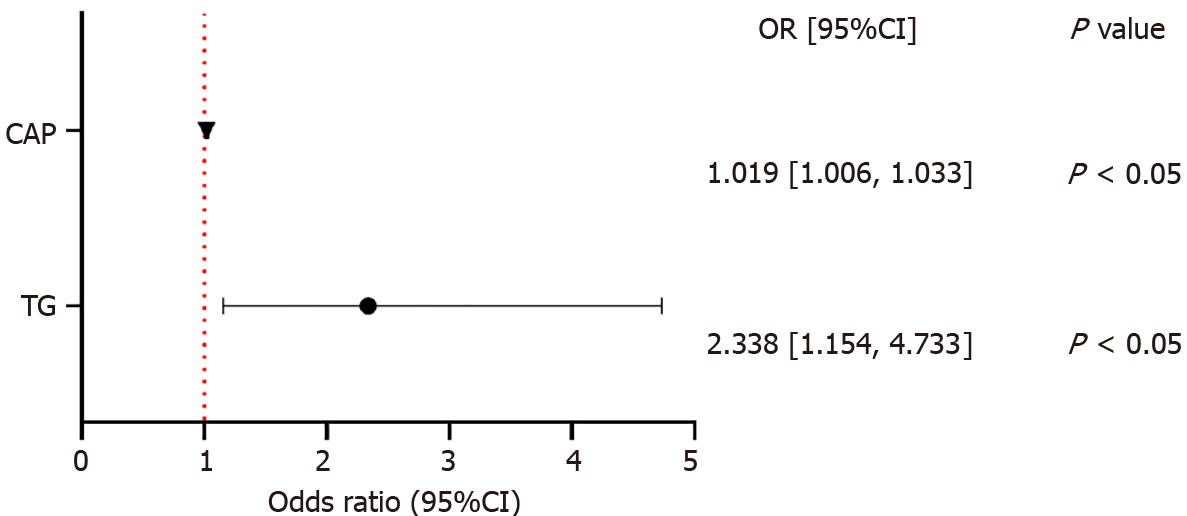
Figure 1 Forest plot of risk factors for colorectal polyps.
The distance between the left and right of each plot represents the confidence interval (CI); the triangle represents the liver-controlled attenuation parameter for colorectal polyps, with an odds ratio of 1.019 (95%CI: 1.006-1.033), P < 0.05; the dot represents the triglyceride for colorectal polyps with an odds ratio of 2.338 (95%CI: 1.154-4.733), P < 0.05. CI: Confidence interval; TG: Triglyceride; CAP: Controlled attenuation parameter.
- Citation: Wang L, Li YF, Dong LF. Transient elastography with controlled attenuation parameter for the diagnosis of colorectal polyps in patients with nonalcoholic fatty liver disease. World J Clin Cases 2024; 12(12): 2050-2055
- URL: https://www.wjgnet.com/2307-8960/full/v12/i12/2050.htm
- DOI: https://dx.doi.org/10.12998/wjcc.v12.i12.2050


