Copyright
©The Author(s) 2024.
World J Clin Cases. Jan 6, 2024; 12(1): 148-156
Published online Jan 6, 2024. doi: 10.12998/wjcc.v12.i1.148
Published online Jan 6, 2024. doi: 10.12998/wjcc.v12.i1.148
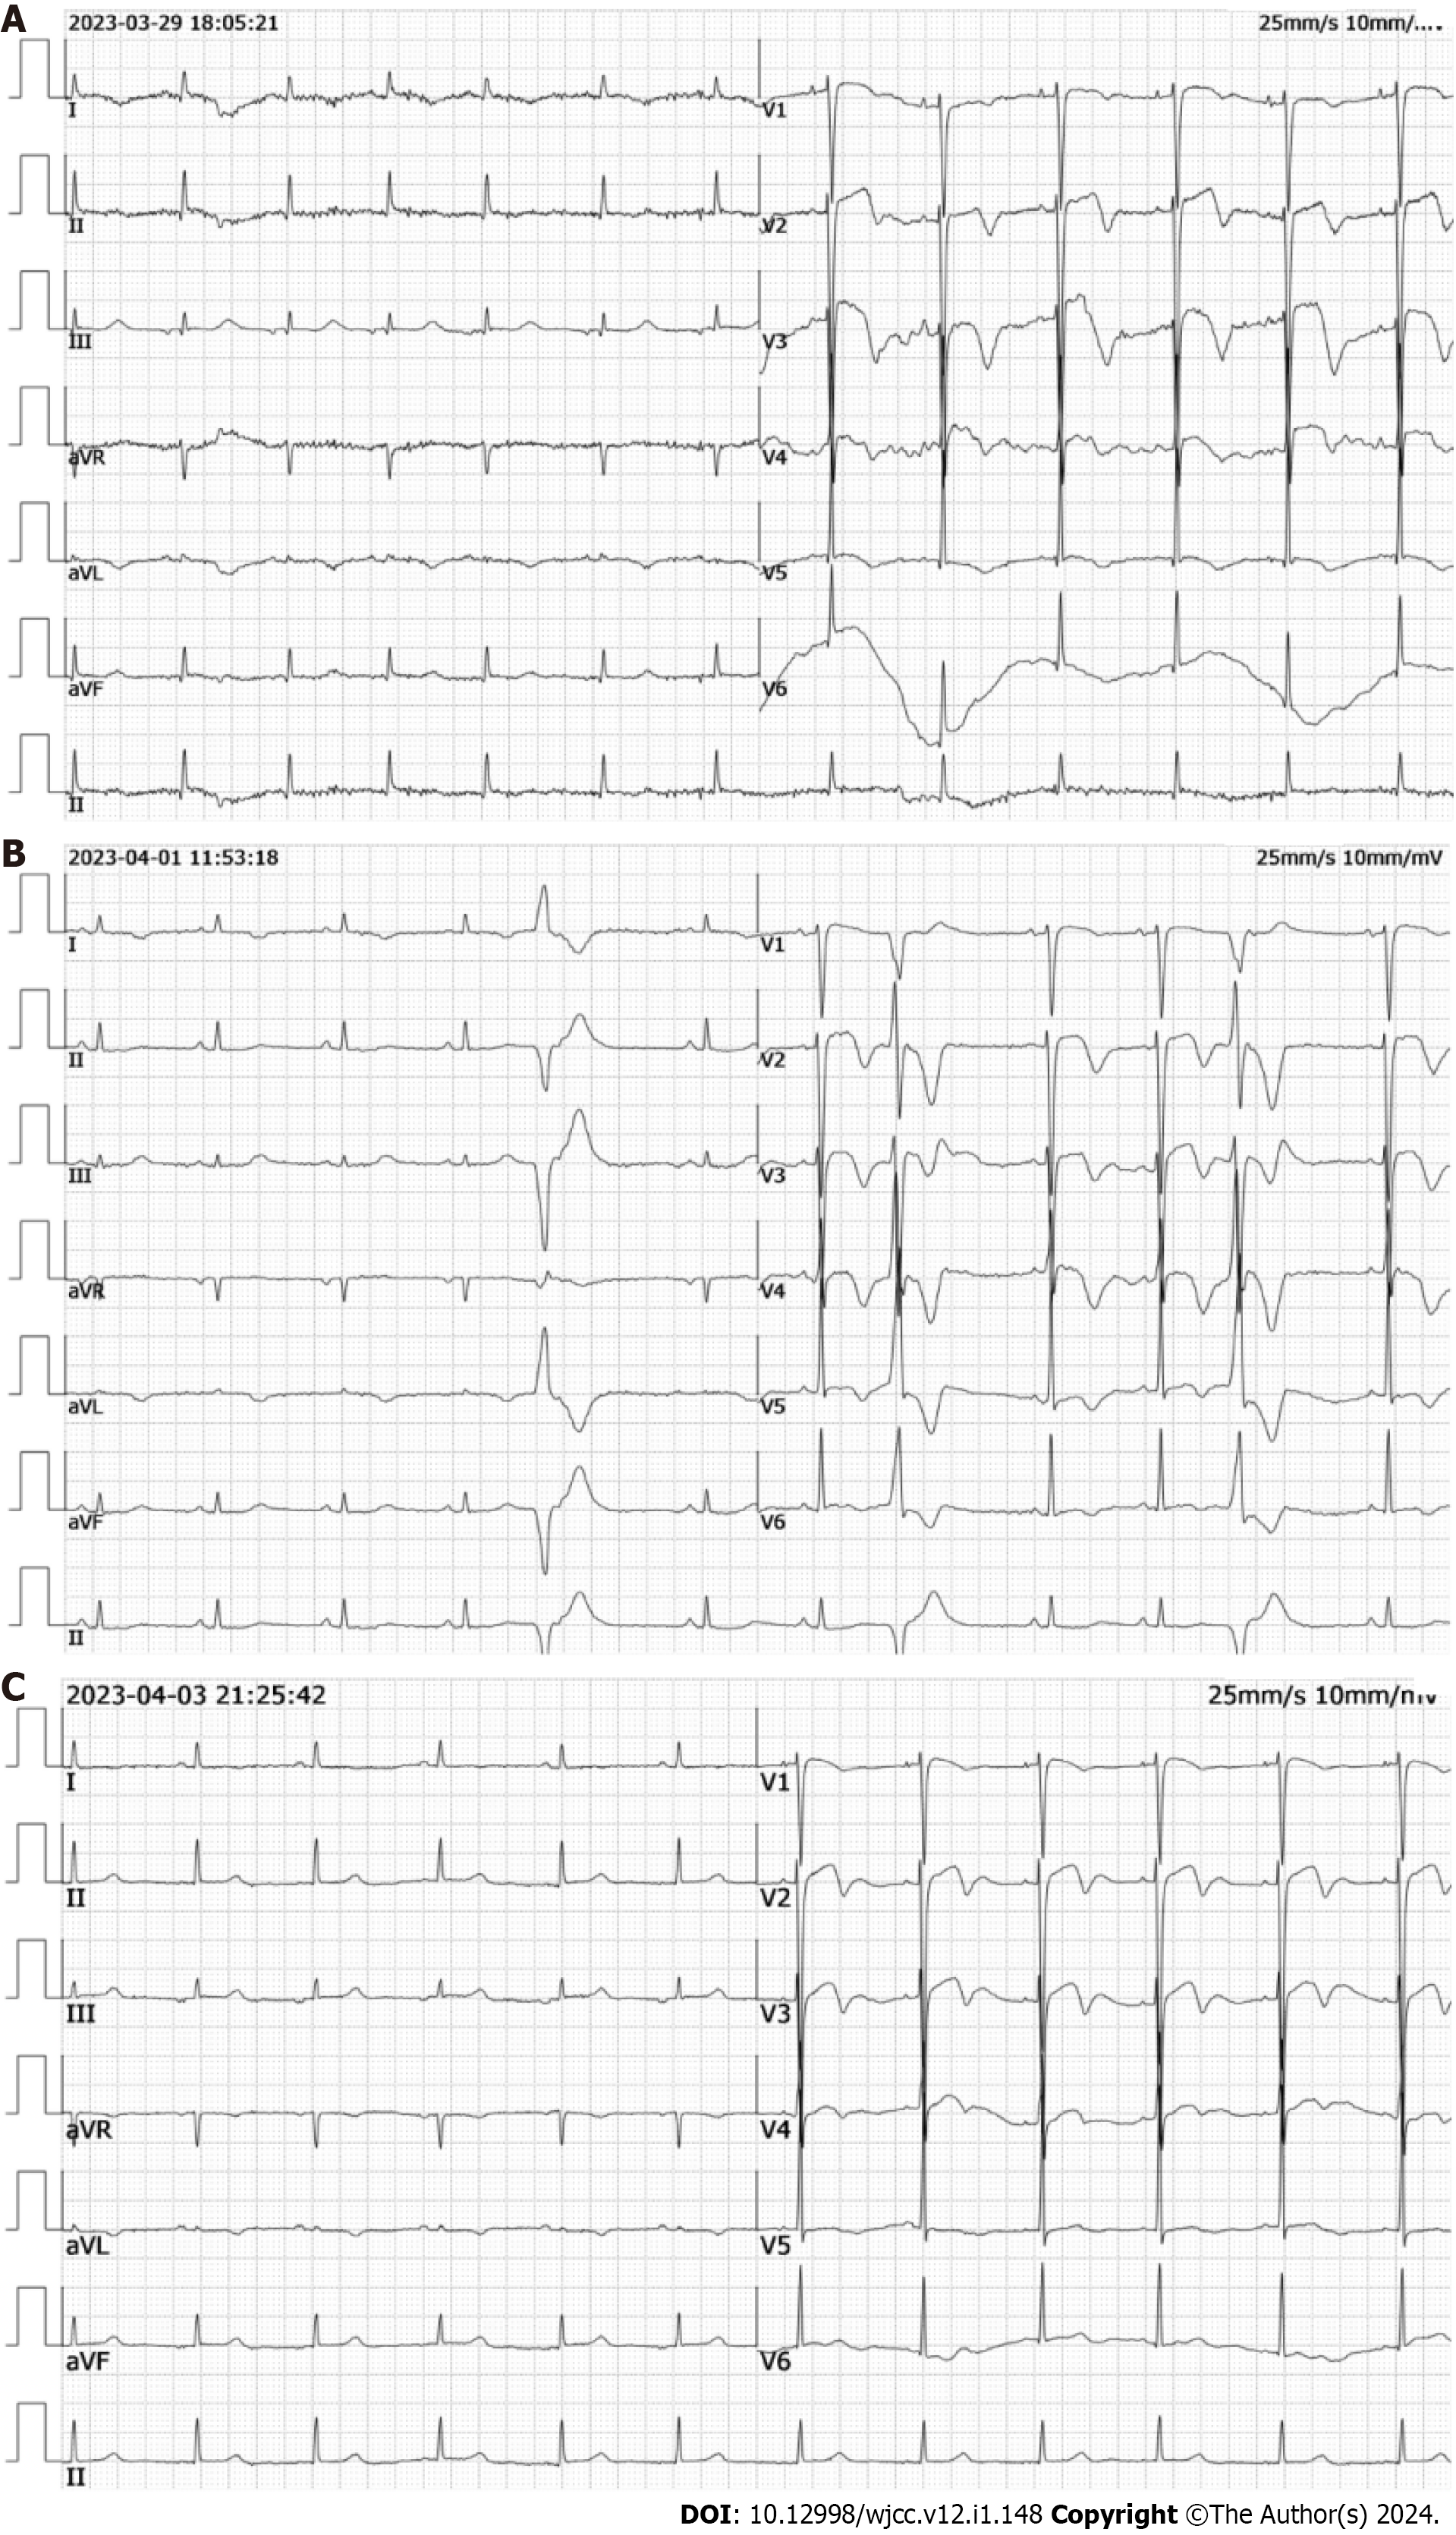
Figure 5 Electrocardiograms.
A: ST-segment elevation and T-wave inversion in leads V2, V3, and V4; B: ST-segment elevation and T-wave inversion are more pronounced, with no pathologic Q waves; C: ST-segment elevation and T-wave inversion have decreased compared to previous readings.
- Citation: Lin JM, Yuan XJ, Li G, Gan XR, Xu WH. Subarachnoid hemorrhage misdiagnosed as acute coronary syndrome leading to catastrophic neurologic injury: A case report. World J Clin Cases 2024; 12(1): 148-156
- URL: https://www.wjgnet.com/2307-8960/full/v12/i1/148.htm
- DOI: https://dx.doi.org/10.12998/wjcc.v12.i1.148


