Copyright
©The Author(s) 2023.
World J Clin Cases. Feb 16, 2023; 11(5): 1188-1197
Published online Feb 16, 2023. doi: 10.12998/wjcc.v11.i5.1188
Published online Feb 16, 2023. doi: 10.12998/wjcc.v11.i5.1188
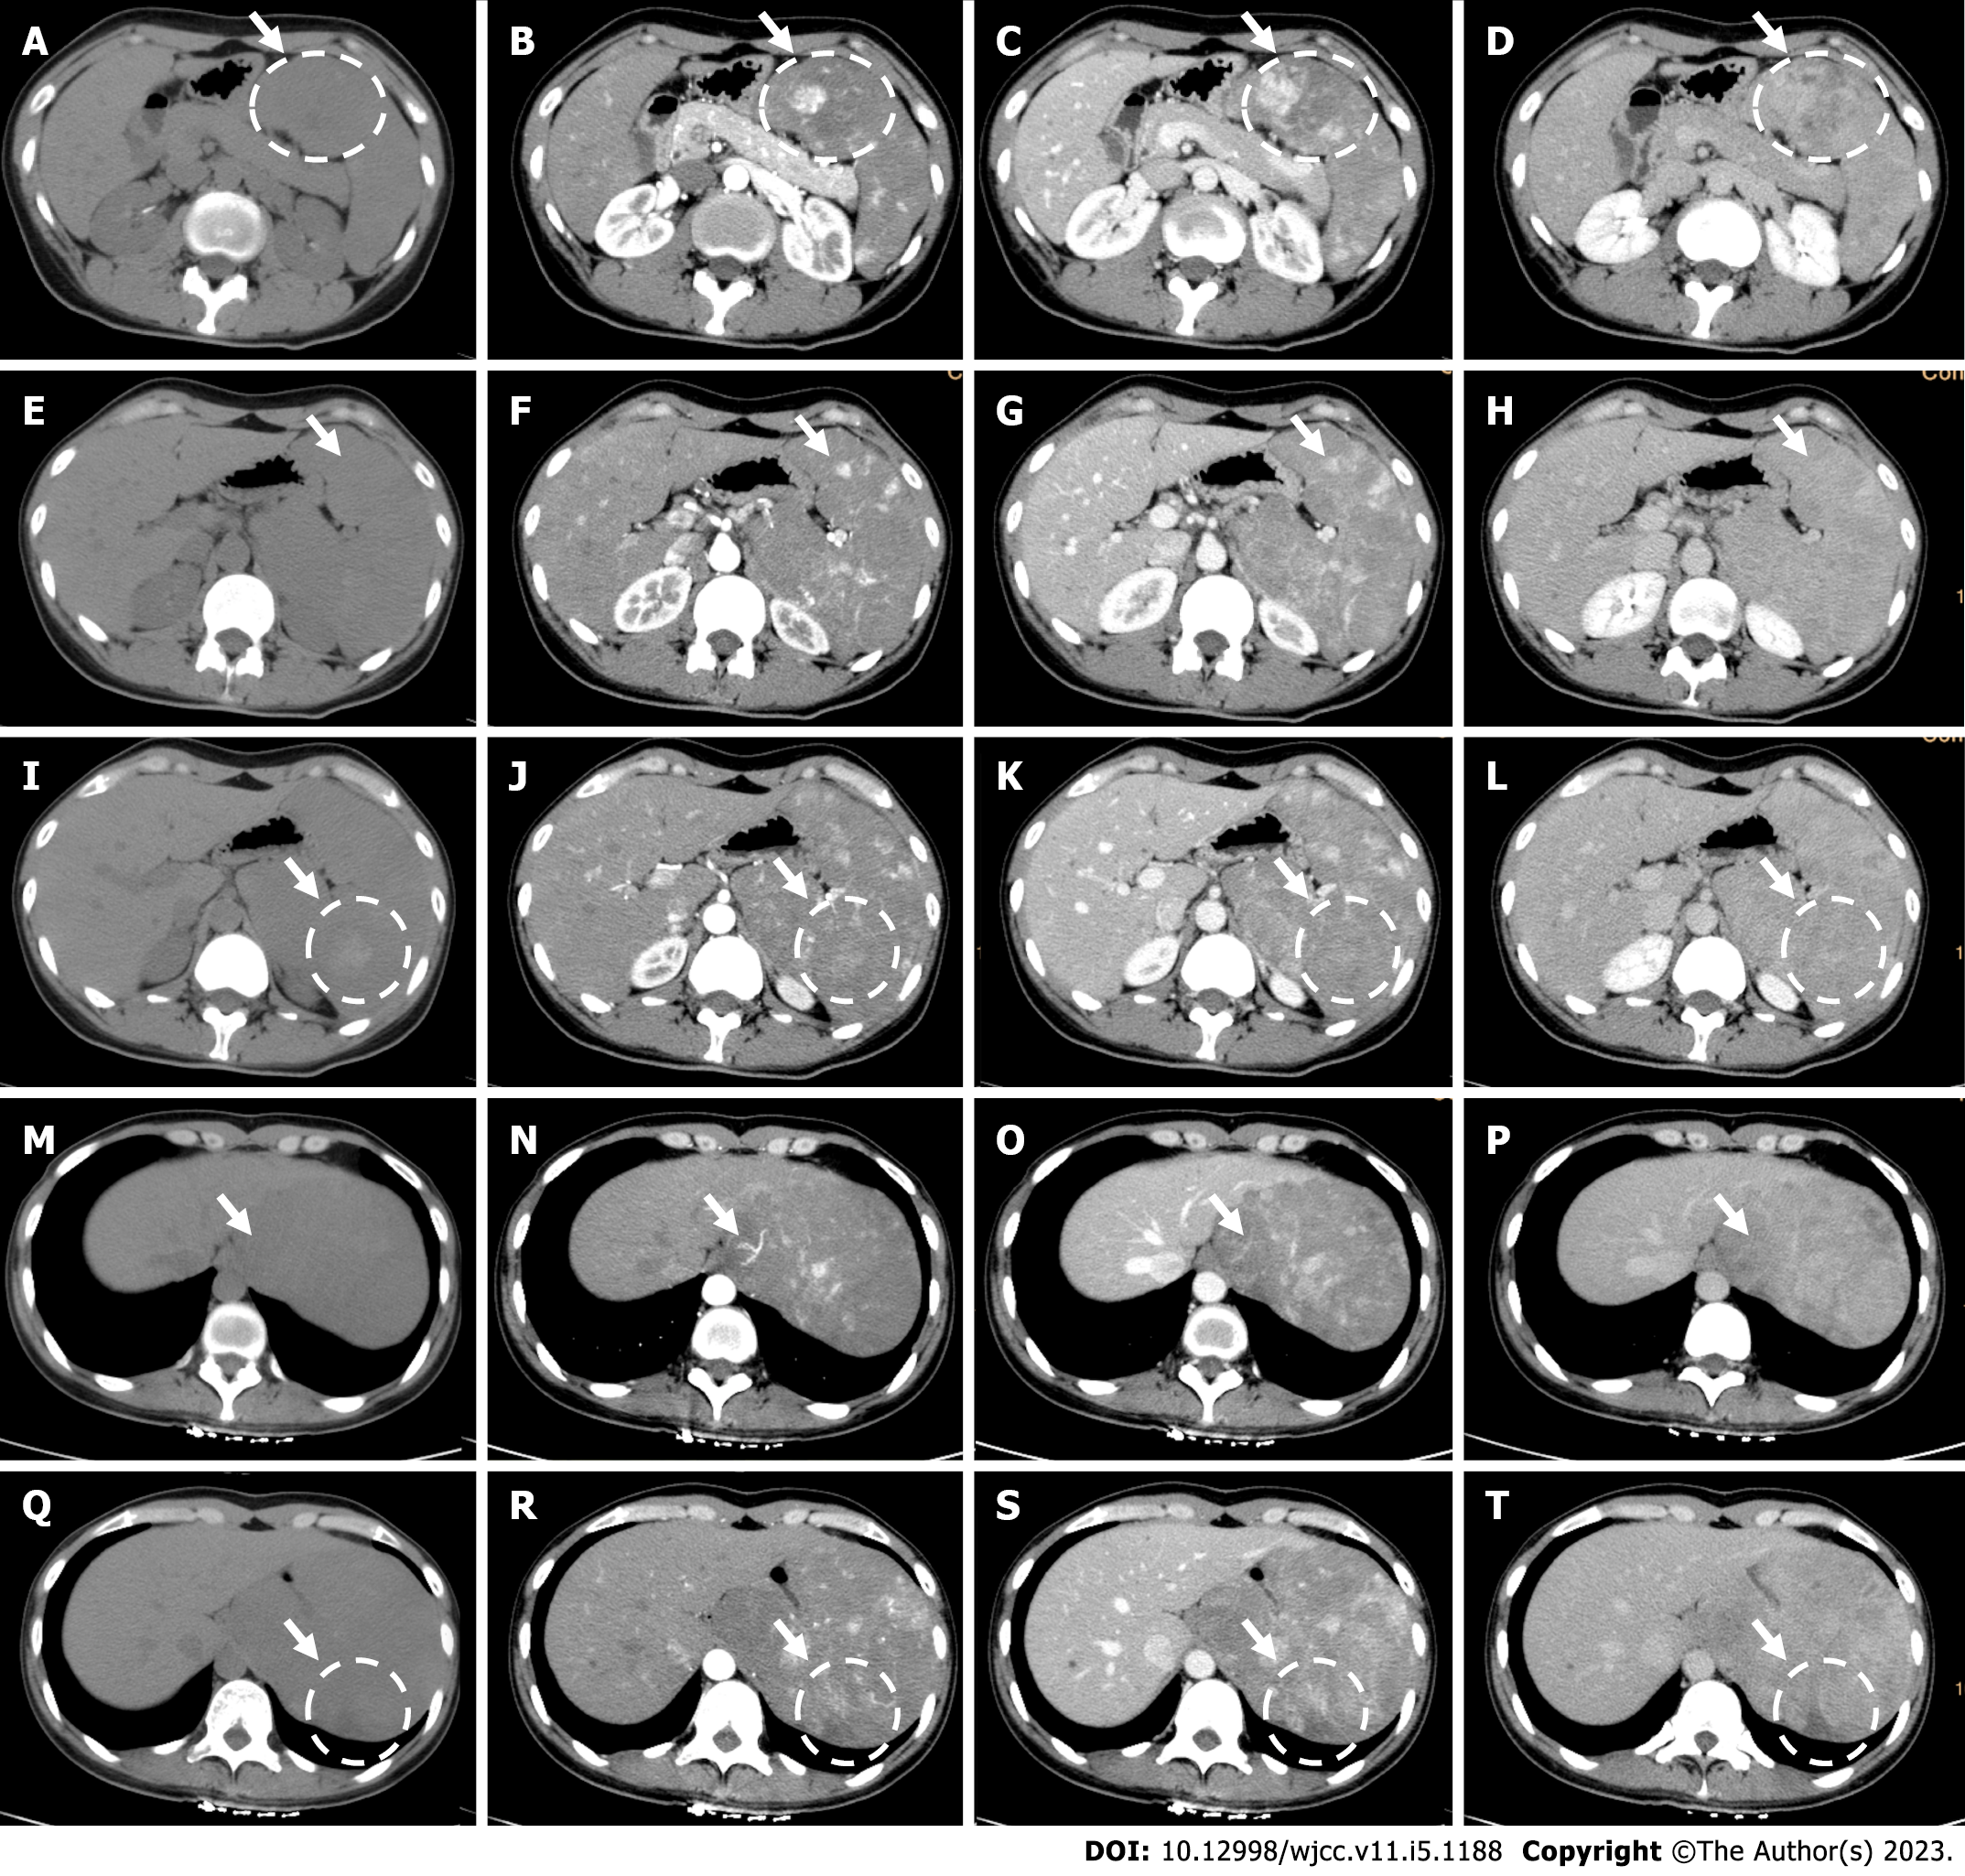
Figure 1 Computed tomography.
A-D: Larger lesions with hypo/iso-density were patchy or nodular enhanced from the peripheral part of the lesions, gradually centripetally full-filled in the venous or delayed phase with decreased degree of enhancement, finally presented with iso-enhancement, and central part of the lesion presented with no enhancement; E-H: Smaller lesions with hypo/iso-density were fully enhanced in the arterial or venous phase presenting hyper-enhancement, then gradually decreased and became iso-enhancement in the delayed phase; I-L: Some lesions showed hyper-density and presented with no obvious enhancement; M-P: Branches of the splenic arteries extending into the larger lesion; Q-T: A peripheral wedge shaped hypo-density area in the spleen showed no obvious enhancement (white arrow).
- Citation: Jia F, Lin H, Li YL, Zhang JL, Tang L, Lu PT, Wang YQ, Cui YF, Yang XH, Lu ZY. Early postsurgical lethal outcome due to splenic littoral cell angioma: A case report. World J Clin Cases 2023; 11(5): 1188-1197
- URL: https://www.wjgnet.com/2307-8960/full/v11/i5/1188.htm
- DOI: https://dx.doi.org/10.12998/wjcc.v11.i5.1188


