Copyright
©The Author(s) 2023.
World J Clin Cases. Dec 16, 2023; 11(35): 8364-8371
Published online Dec 16, 2023. doi: 10.12998/wjcc.v11.i35.8364
Published online Dec 16, 2023. doi: 10.12998/wjcc.v11.i35.8364
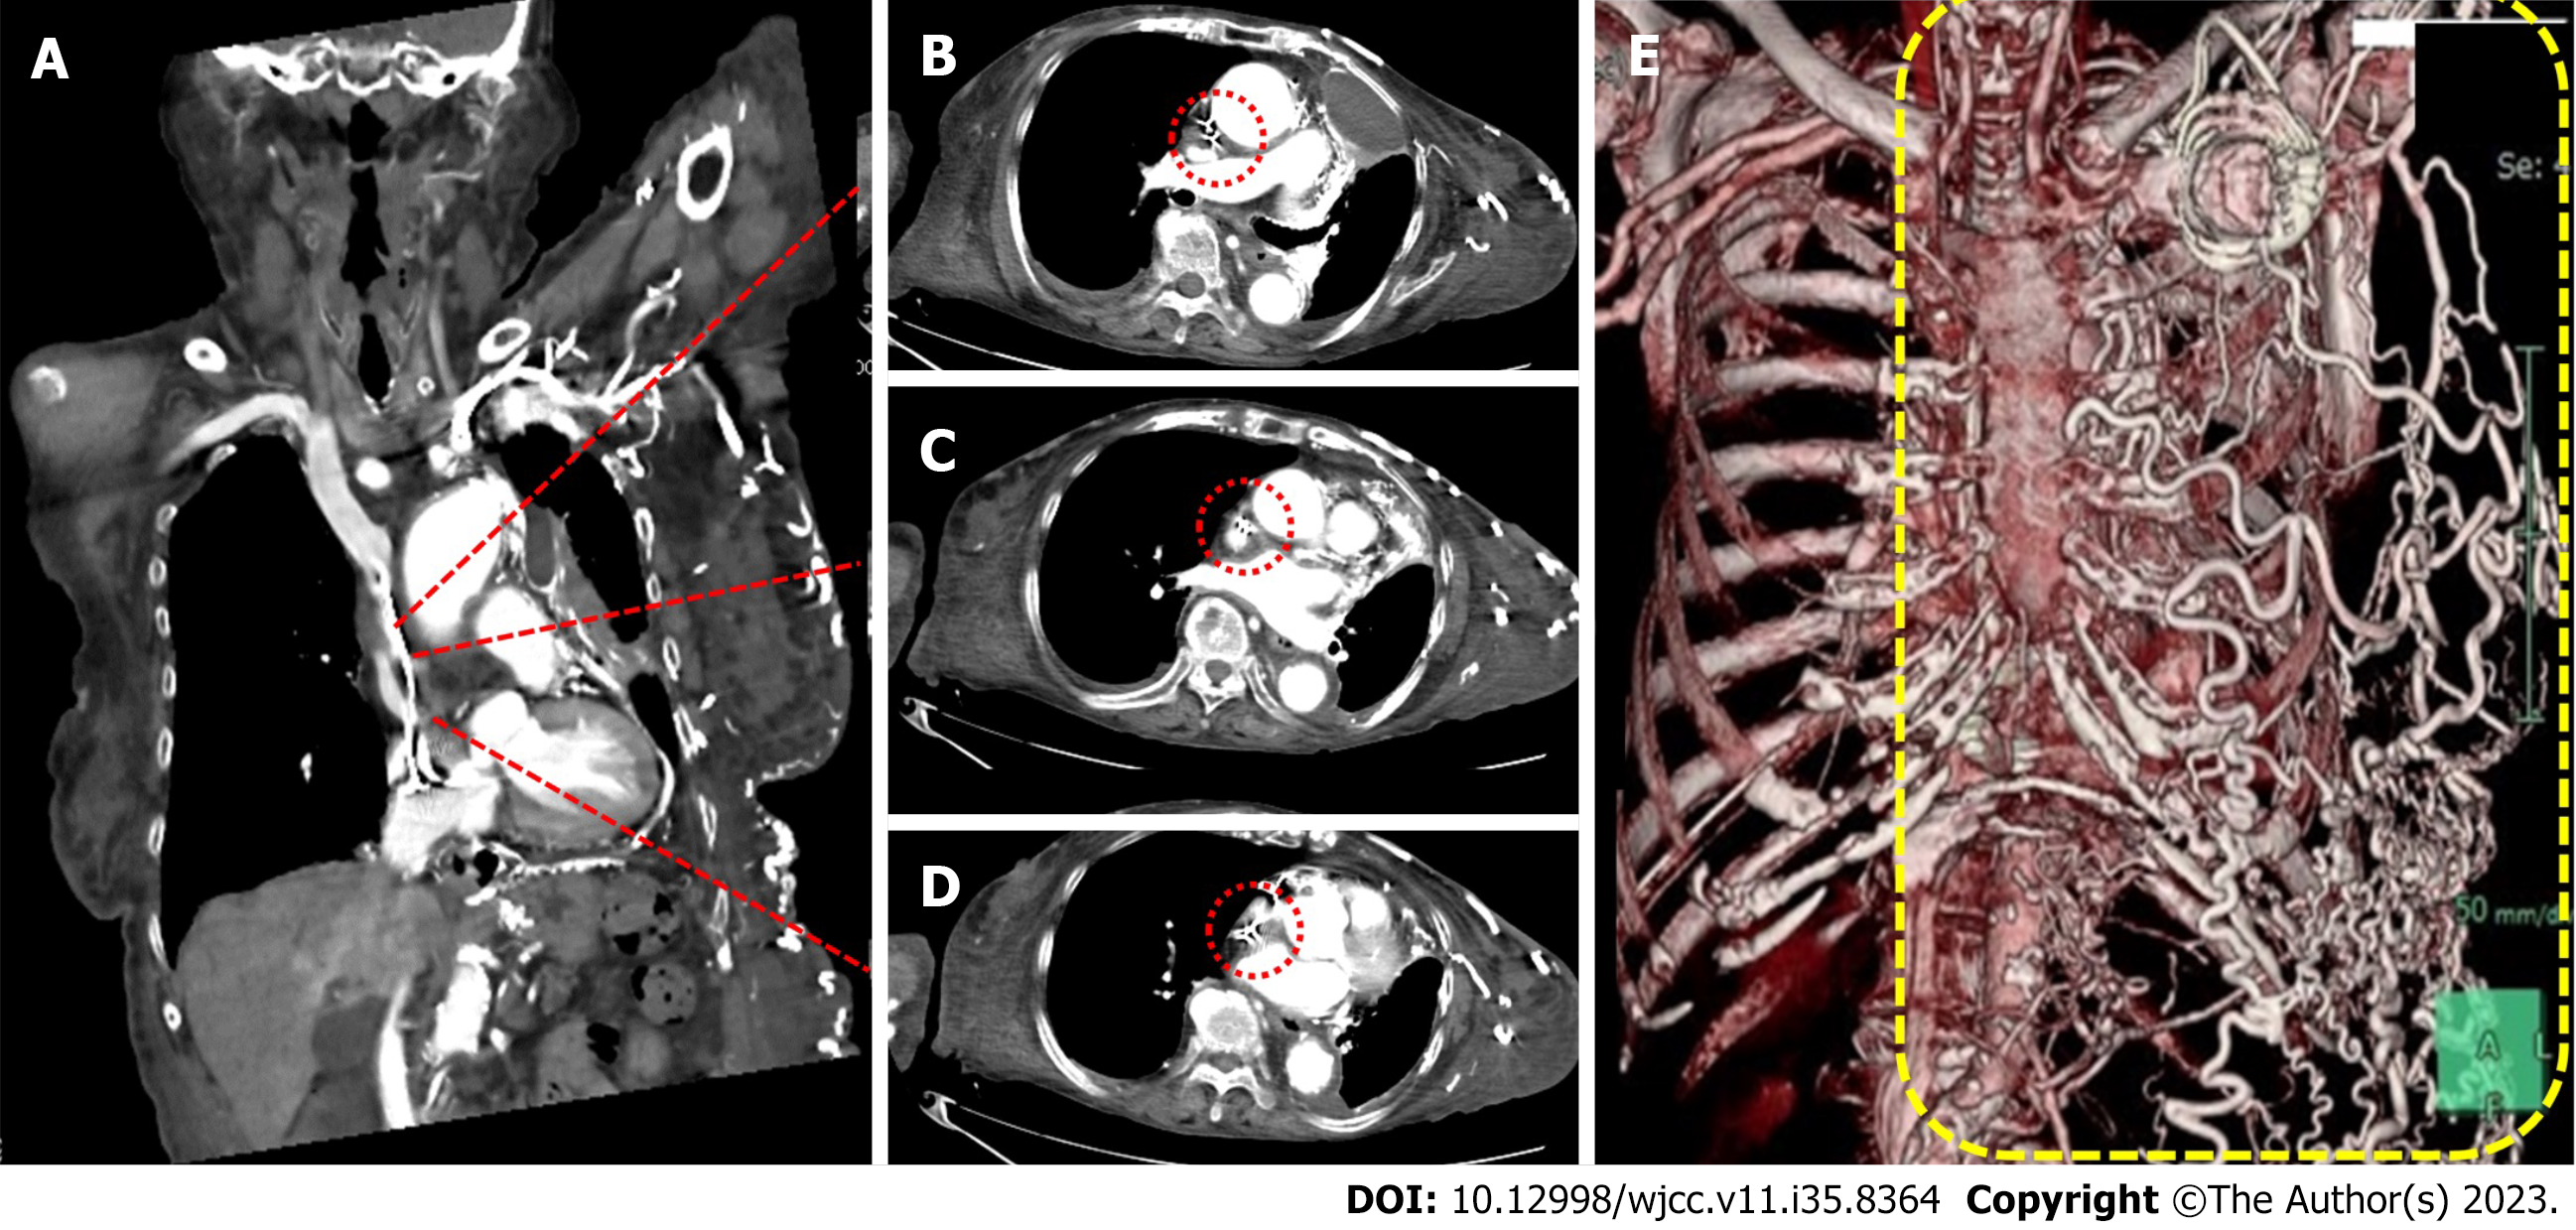
Figure 4 Contrast-enhanced computed tomography of the superior vena cava.
A: Coronal section of the upper body; B-D: Transverse sections of the upper body; the dashed red line represents the superior vena cava (the most stenotic site; D); E: 3D volume-rendered image of the collateral circulation (inside the yellow-dashed rectangle).
- Citation: Yamamoto S, Kamezaki M, Ooka J, Mazaki T, Shimoda Y, Nishihara T, Adachi Y. Balloon venoplasty for disdialysis syndrome due to pacemaker-related superior vena cava syndrome with chylothorax post-bacteraemia: A case report. World J Clin Cases 2023; 11(35): 8364-8371
- URL: https://www.wjgnet.com/2307-8960/full/v11/i35/8364.htm
- DOI: https://dx.doi.org/10.12998/wjcc.v11.i35.8364


