Copyright
©The Author(s) 2023.
World J Clin Cases. Oct 26, 2023; 11(30): 7318-7328
Published online Oct 26, 2023. doi: 10.12998/wjcc.v11.i30.7318
Published online Oct 26, 2023. doi: 10.12998/wjcc.v11.i30.7318
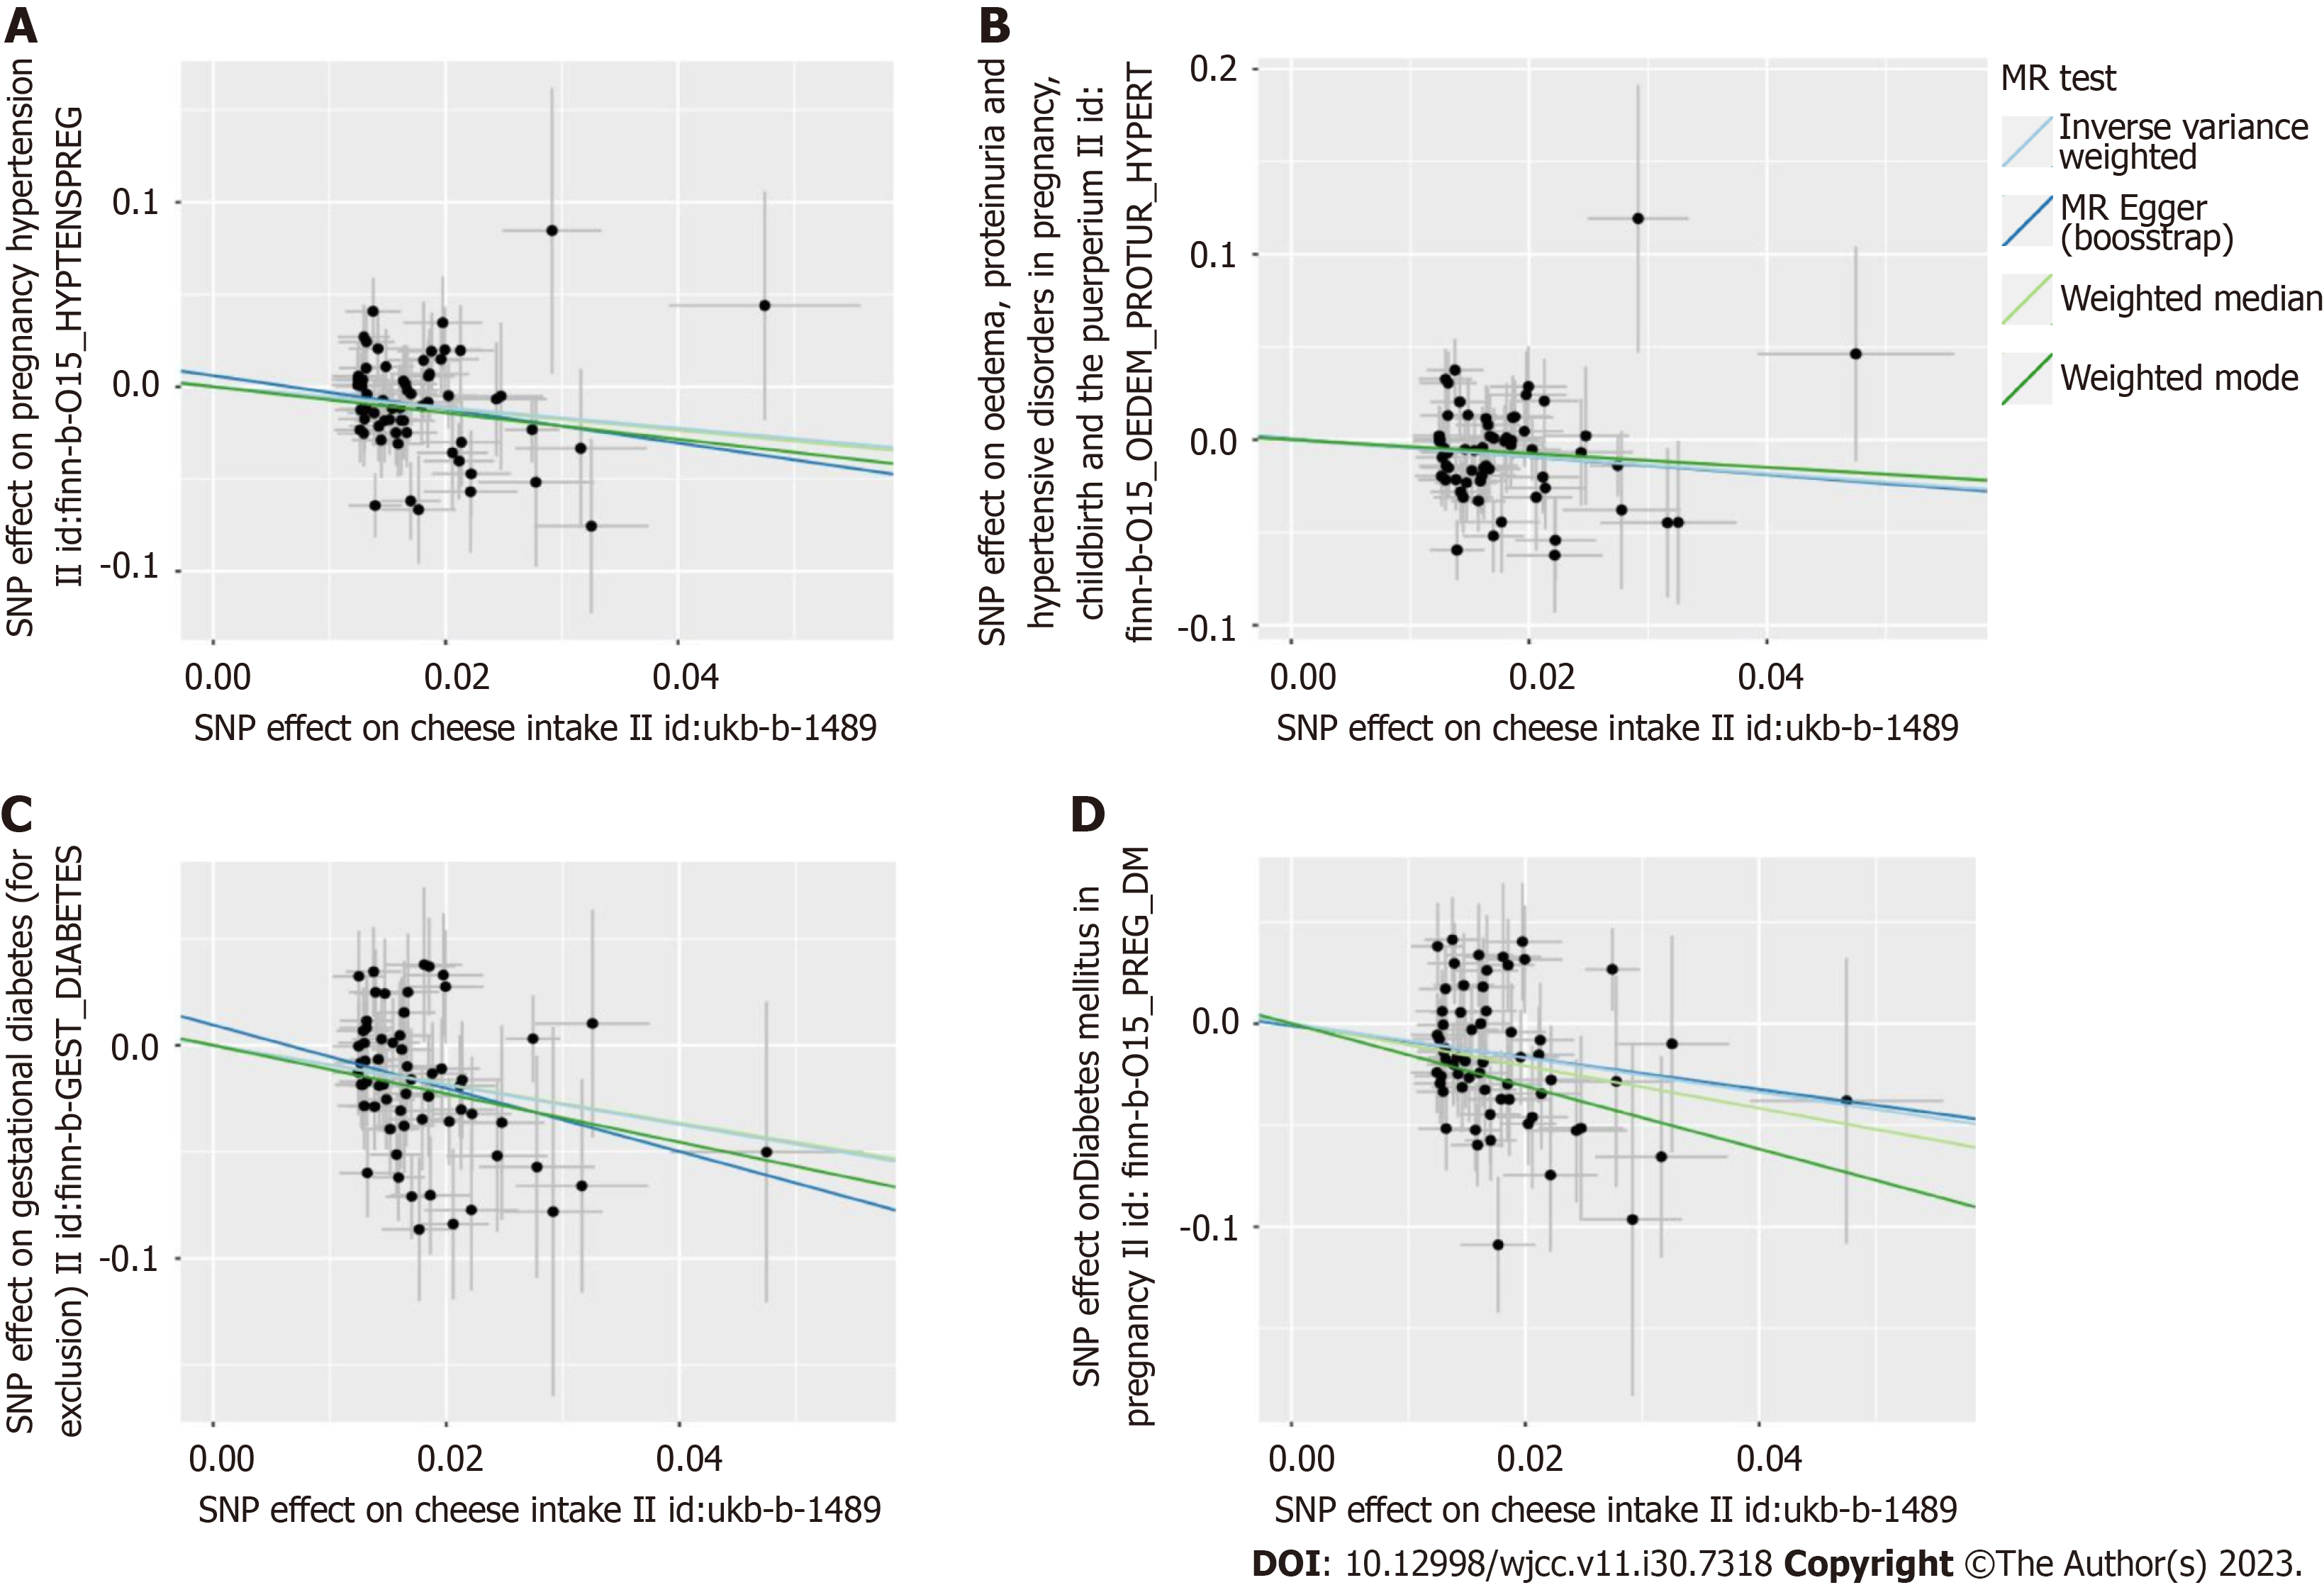
Figure 3 Scatter plot to visualize causal effect of cheese intake on gestational hypertension and gestational diabetes risk using four Mendelian randomization methods.
The slope of the straight line indicates the magnitude of the causal association. The plot presents the effect sizes of the single nucleotide polymorphisms (SNP)-cheese intake association (X-axis, standard deviation units) and the SNP-gestational hypertension and gestational diabetes association [Y-axis, log (odds ratio)] with 95% confidence intervals. The regression slopes of the lines correspond to causal estimates using the four Mendelian randomization methods. A: The Scatter plot visualize causal effect of cheese intake on gestational hypertension risk in the FinnGen Biobank database; B: The Scatter plot visualize causal effect of cheese intake on gestational hypertension risk in the FinnGen Biobank database; C: The Scatter plot visualize causal effect of cheese intake on gestational diabetes risk in the FinnGen Biobank database; D: The Scatter plot visualize causal effect of cheese intake on gestational diabetes risk in the FinnGen Biobank database. SNPs: Single nucleotide polymorphisms; MR: Mendelian randomization.
- Citation: Zhong T, Huang YQ, Wang GM. Causal relationship association of cheese intake with gestational hypertension and diabetes result from a Mendelian randomization study. World J Clin Cases 2023; 11(30): 7318-7328
- URL: https://www.wjgnet.com/2307-8960/full/v11/i30/7318.htm
- DOI: https://dx.doi.org/10.12998/wjcc.v11.i30.7318


