Copyright
©The Author(s) 2023.
World J Clin Cases. Jan 26, 2023; 11(3): 692-699
Published online Jan 26, 2023. doi: 10.12998/wjcc.v11.i3.692
Published online Jan 26, 2023. doi: 10.12998/wjcc.v11.i3.692
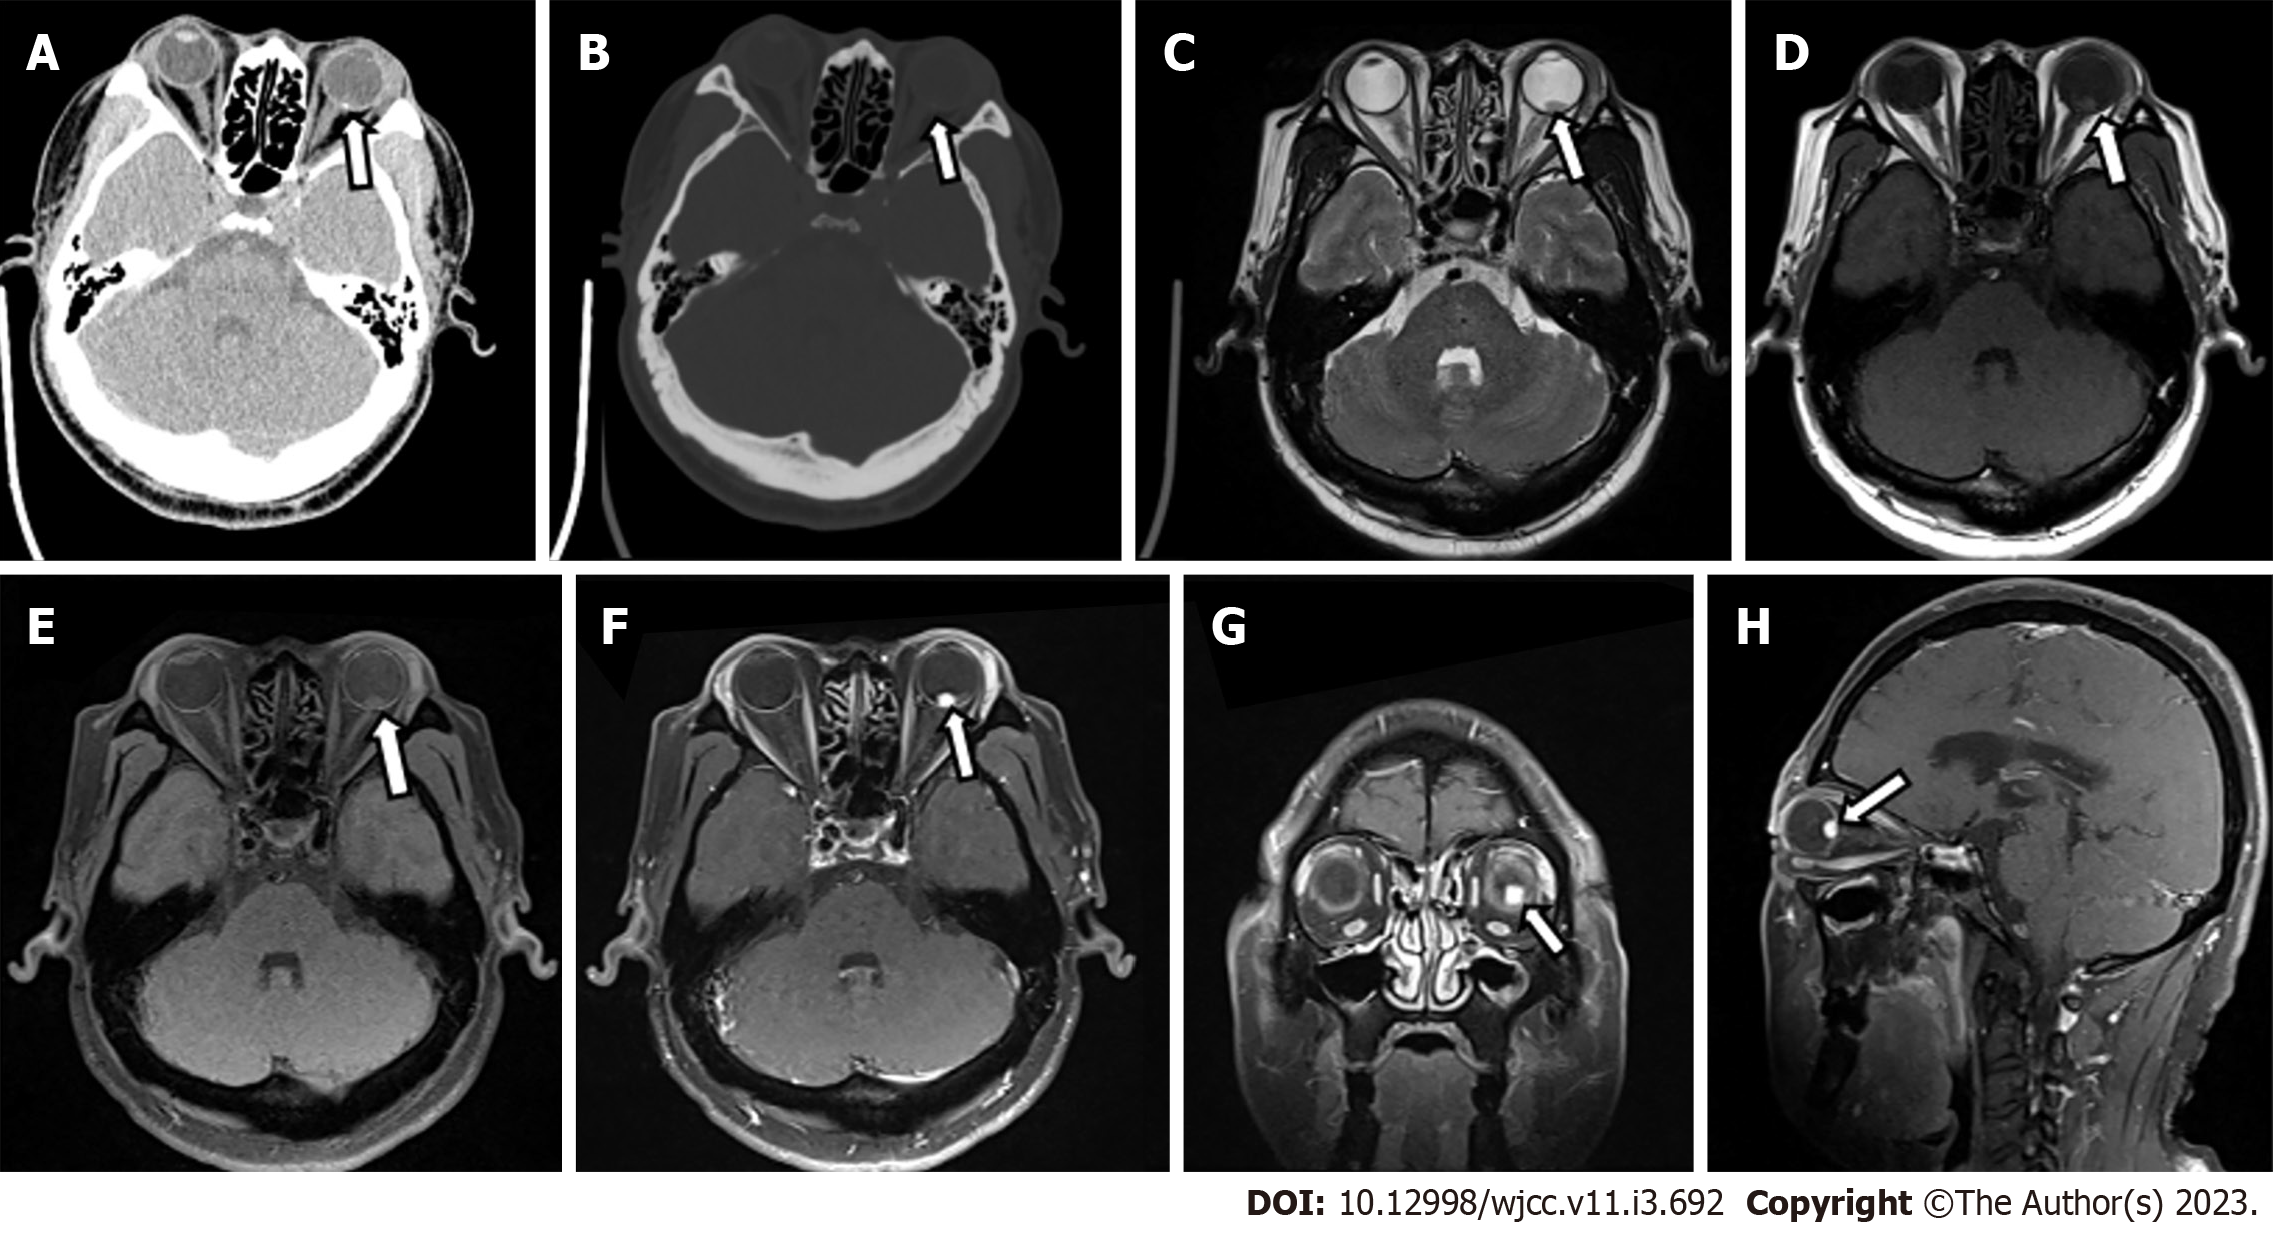
Figure 2 Computed tomography and magnetic resonance imaging of left retinal hemangioblastoma.
A: Computed tomography (CT) transverse soft tissue window of orbit showed punctate calcification on the posterior wall of the left eye ring and small patchy soft tissue density in the posterior part of the eyeball. The lesion measured about 5 mm × 8 mm, with an ill-defined border; B: CT transverse bone window of orbital showed no obvious abnormal change of orbital bone; C: The lesion was hypointense on transaxial T2-weighted sequence; D and E: The lesion was slightly hyperintense on transaxial T1-weighted images (D) and transaxial T1-weighted + fat-suppression images (E); F-H: Left posterior para-bulbar lesions were significantly enhanced on gadolinium-enhanced T1-weighted + fat-suppression images [mainly included transverse (F), coronal (G), and sagittal sequences (H)] (White arrows represent lesion).
- Citation: Tang X, Ji HM, Li WW, Ding ZX, Ye SL. Imaging features of retinal hemangioblastoma: A case report. World J Clin Cases 2023; 11(3): 692-699
- URL: https://www.wjgnet.com/2307-8960/full/v11/i3/692.htm
- DOI: https://dx.doi.org/10.12998/wjcc.v11.i3.692


