Copyright
©The Author(s) 2023.
World J Clin Cases. Oct 16, 2023; 11(29): 7026-7033
Published online Oct 16, 2023. doi: 10.12998/wjcc.v11.i29.7026
Published online Oct 16, 2023. doi: 10.12998/wjcc.v11.i29.7026
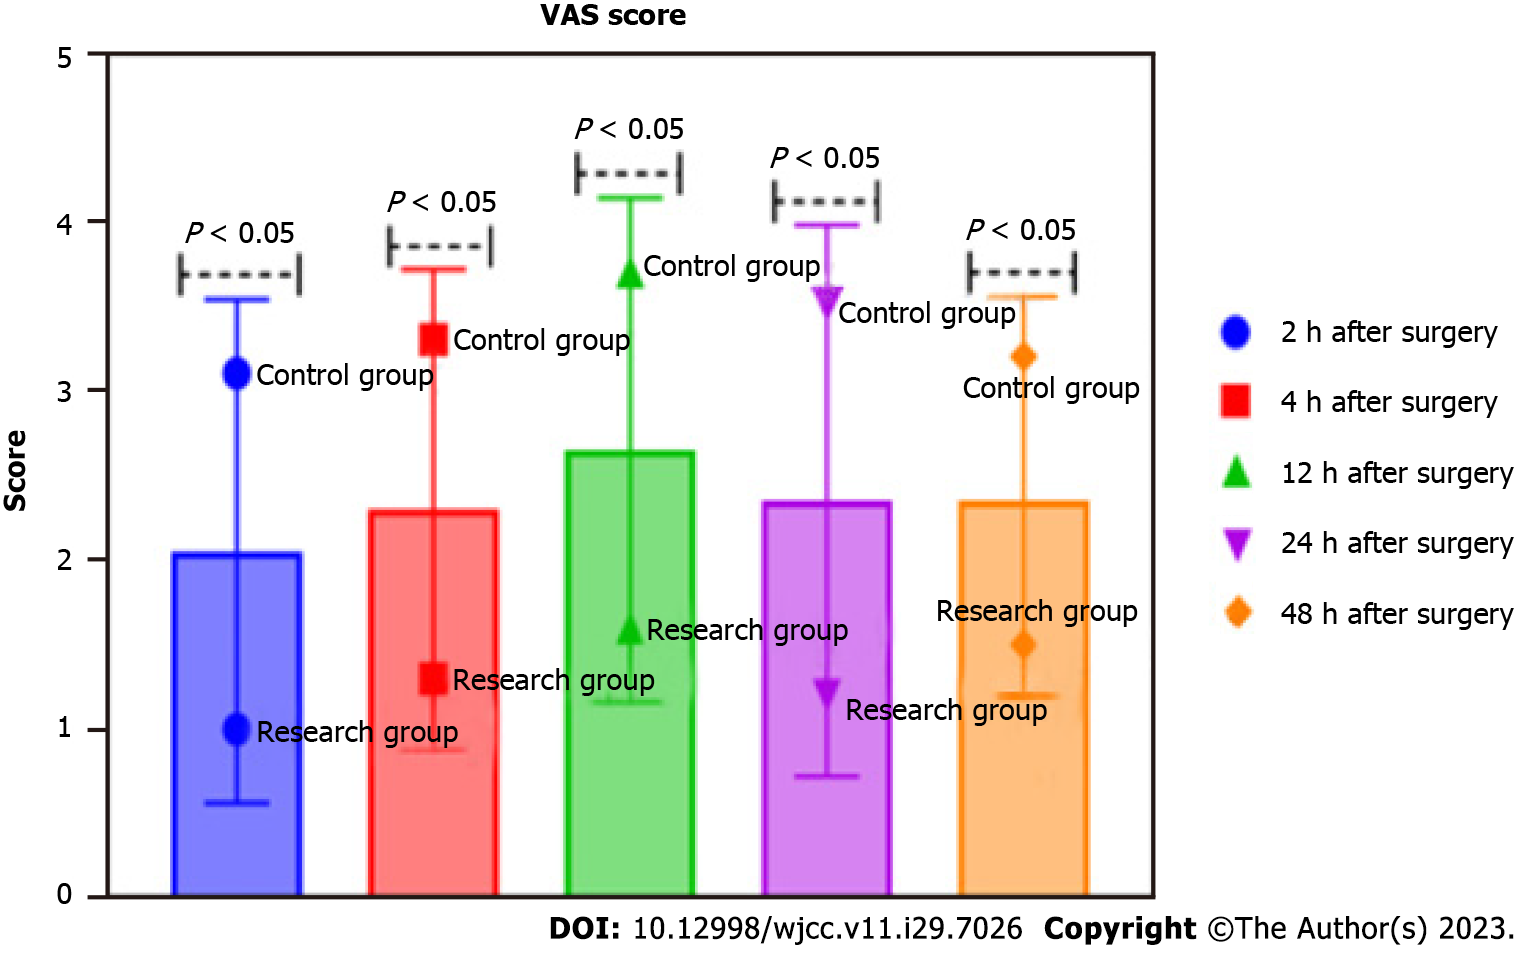
Figure 3 Comparative of visual analogue scale scores (points, mean ± SD).
The visual analogue scale (VAS) score of the research group is lower than that of the control group after surgery. P < 0.05 means that the VAS score of the control group and the research group at different time points (2 h, 4 h, 12 h, 24 h, 48 h) after surgery, the variance is significant difference. VAS: Visual analogue scale.
- Citation: Tong SX, Li RS, Wang D, Xie XM, Ruan Y, Huang L. Artificial intelligence technology and ultrasound-guided nerve block for analgesia in total knee arthroplasty. World J Clin Cases 2023; 11(29): 7026-7033
- URL: https://www.wjgnet.com/2307-8960/full/v11/i29/7026.htm
- DOI: https://dx.doi.org/10.12998/wjcc.v11.i29.7026


