Copyright
©The Author(s) 2023.
World J Clin Cases. Oct 6, 2023; 11(28): 6857-6863
Published online Oct 6, 2023. doi: 10.12998/wjcc.v11.i28.6857
Published online Oct 6, 2023. doi: 10.12998/wjcc.v11.i28.6857
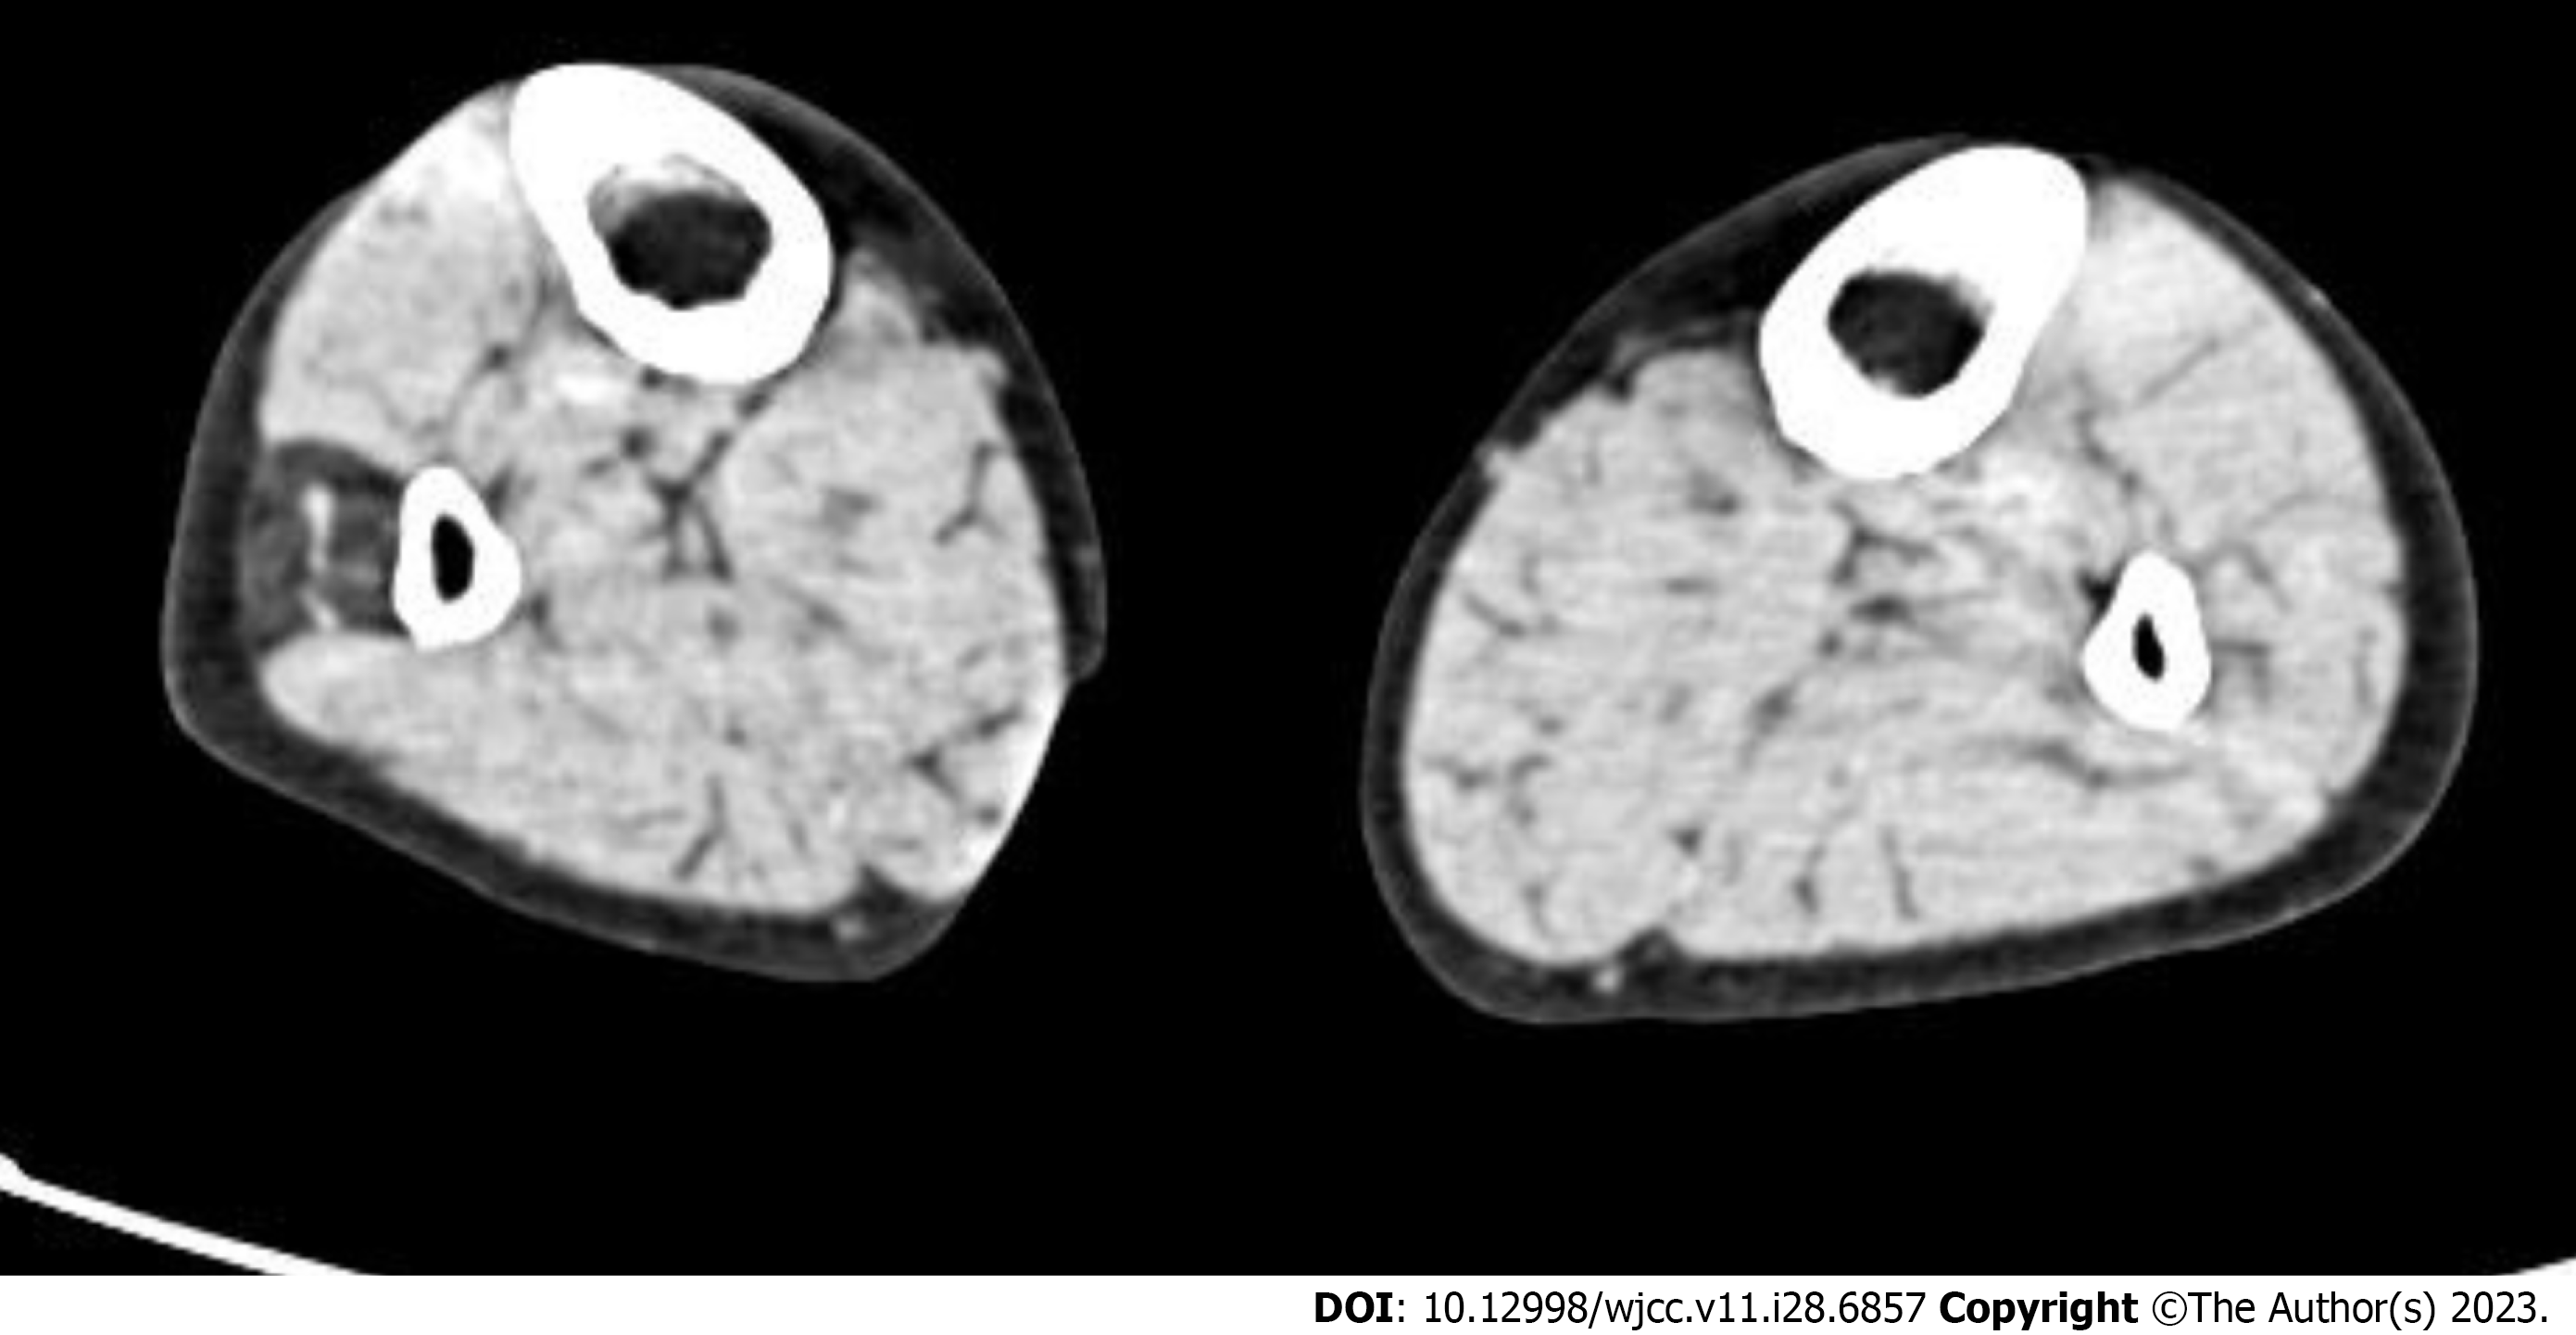
Figure 2 Results of the computed tomography scan of both lower extremities.
Cross sectional area of the right peroneal muscles: 209.55 mm2; average Hounsfield unit for the right peroneal muscles: -50.16; cross sectional area of the left peroneal muscles: 332.22 mm2; Hounsfield unit for the left peroneal muscles: 34.28.
- Citation: Lin JC, Tsai MH, Lin WP, Kuan TS, Lien WC. Entrapment neuropathy of common peroneal nerve by fabella: A case report. World J Clin Cases 2023; 11(28): 6857-6863
- URL: https://www.wjgnet.com/2307-8960/full/v11/i28/6857.htm
- DOI: https://dx.doi.org/10.12998/wjcc.v11.i28.6857


