Copyright
©The Author(s) 2023.
World J Clin Cases. Oct 6, 2023; 11(28): 6733-6743
Published online Oct 6, 2023. doi: 10.12998/wjcc.v11.i28.6733
Published online Oct 6, 2023. doi: 10.12998/wjcc.v11.i28.6733
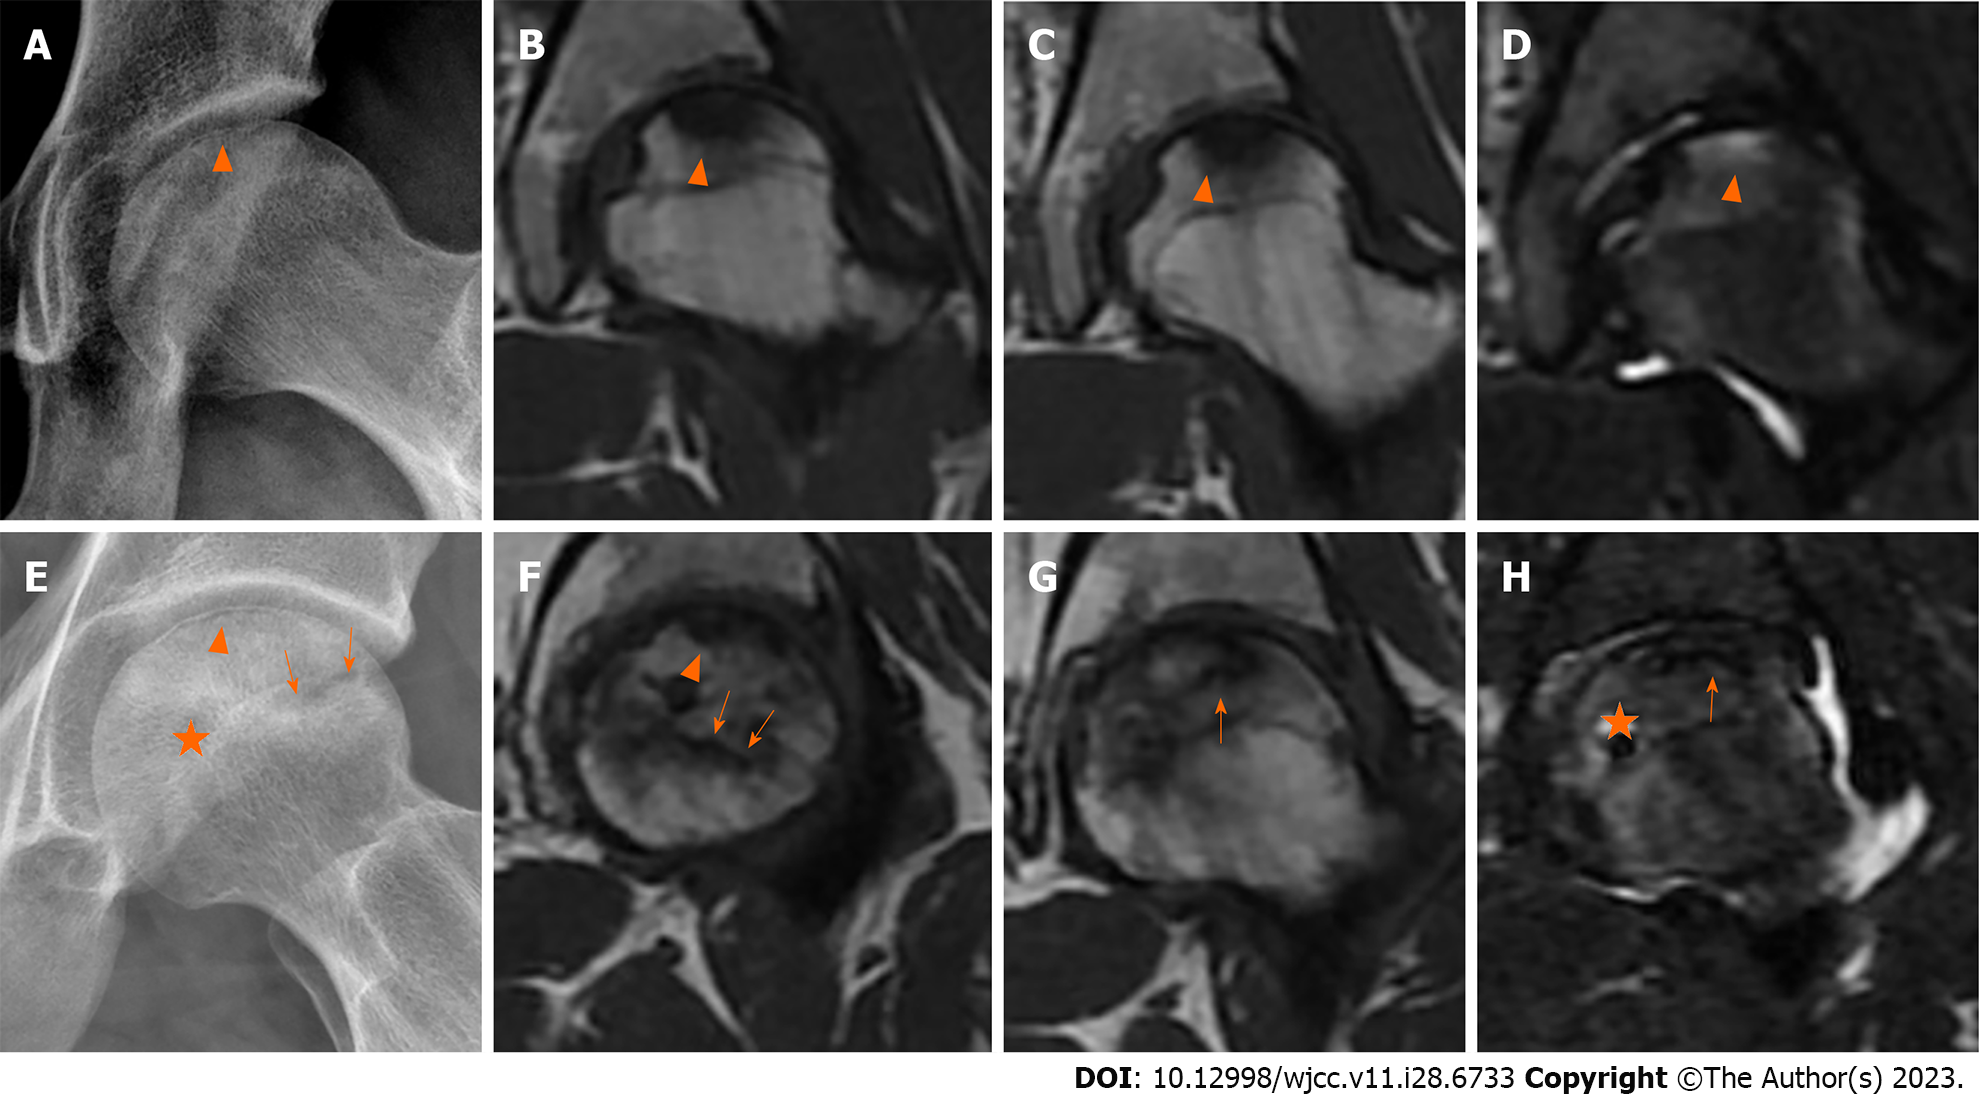
Figure 3 Representative radiographs and magnetic resonance imaging images of subchondral fatigue fracture of the femoral head and osteonecrosis of the femoral head.
A: Subchondral fracture lines (arrowhead); B and C: Hypointense signal in T1-weighted images; D: Hypointense signal with joint effusion in T2-weighted image; E: Subchondral fracture lines (arrowhead); F and G: Reactive interface line in T1-weighted image (arrow); H: Cystic degeneration in T2-weighted image (star).
- Citation: Yang JZ, Chen P, Chen BH, Zhao B. Subchondral fatigue fracture of the femoral head in young military recruits: Potential risk factors. World J Clin Cases 2023; 11(28): 6733-6743
- URL: https://www.wjgnet.com/2307-8960/full/v11/i28/6733.htm
- DOI: https://dx.doi.org/10.12998/wjcc.v11.i28.6733


