Copyright
©The Author(s) 2023.
World J Clin Cases. Aug 26, 2023; 11(24): 5710-5720
Published online Aug 26, 2023. doi: 10.12998/wjcc.v11.i24.5710
Published online Aug 26, 2023. doi: 10.12998/wjcc.v11.i24.5710
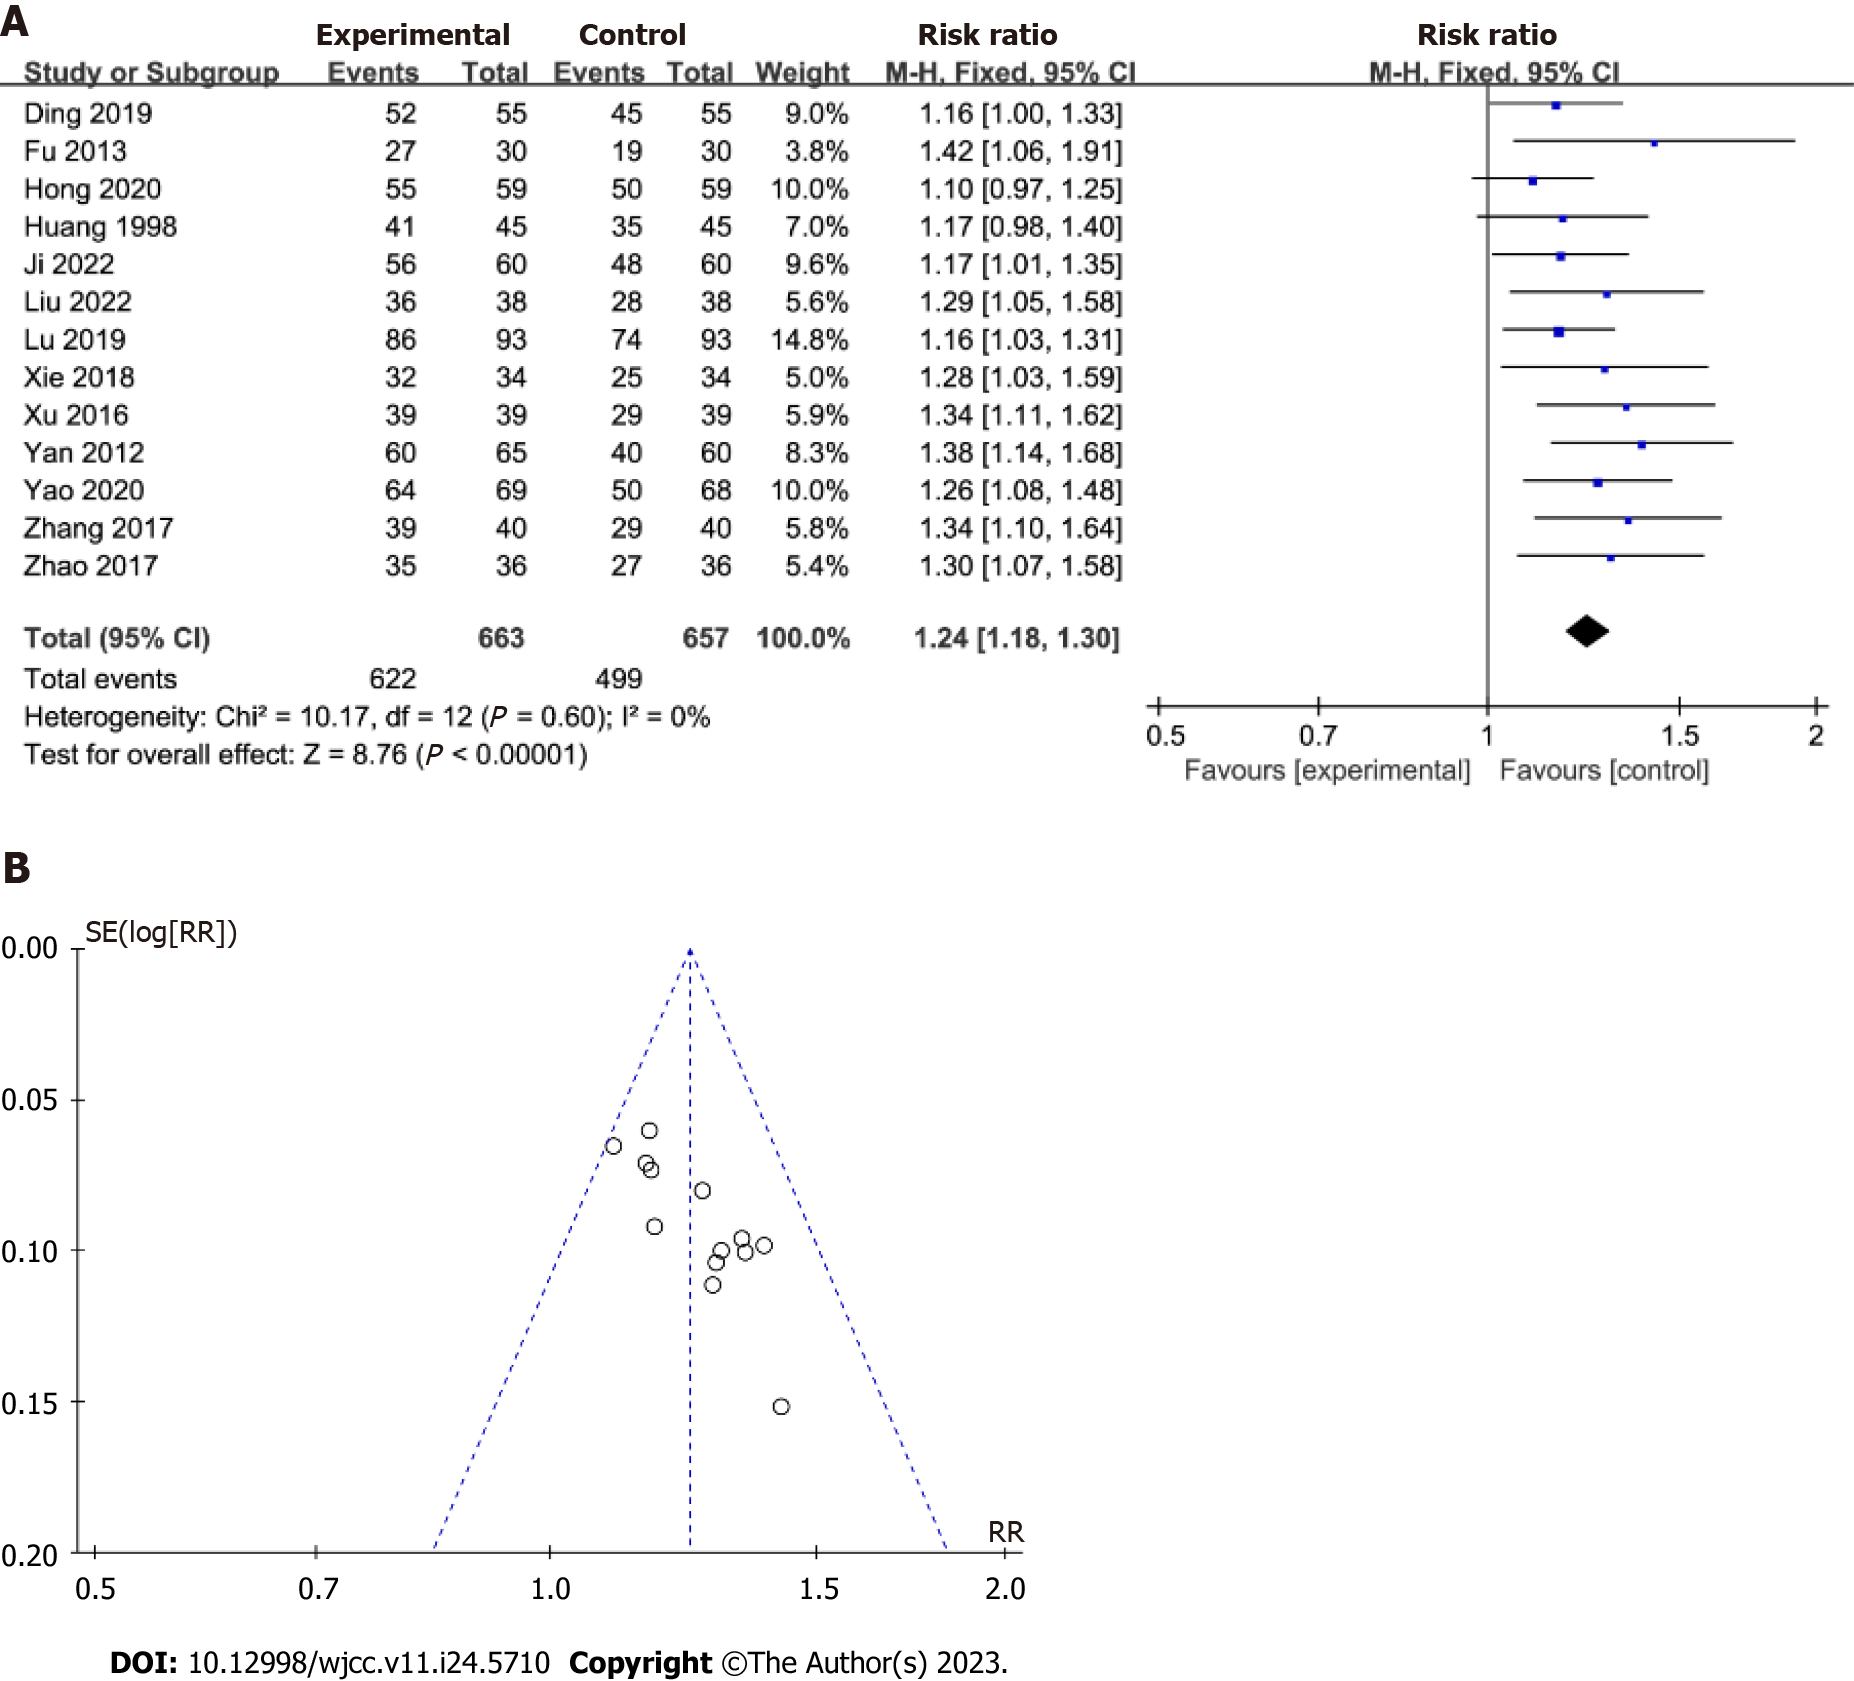
Figure 3 Forest plots representing the effect of chronic atrophic gastritis on the total effective rate in the experimental group vs the control group.
A: Overall comparison of forest plot of chronic atrophic gastritis; B: Comparison of heterogeneity in funnel plot of included literature.
- Citation: Yan XP, Si W, Ding MS, Tian YF, Guo Z. Efficacy and safety of Huangqi Jianzhong decoction in the treatment of chronic atrophic gastritis: A meta-analysis. World J Clin Cases 2023; 11(24): 5710-5720
- URL: https://www.wjgnet.com/2307-8960/full/v11/i24/5710.htm
- DOI: https://dx.doi.org/10.12998/wjcc.v11.i24.5710


