Copyright
©The Author(s) 2023.
World J Clin Cases. Aug 16, 2023; 11(23): 5547-5553
Published online Aug 16, 2023. doi: 10.12998/wjcc.v11.i23.5547
Published online Aug 16, 2023. doi: 10.12998/wjcc.v11.i23.5547
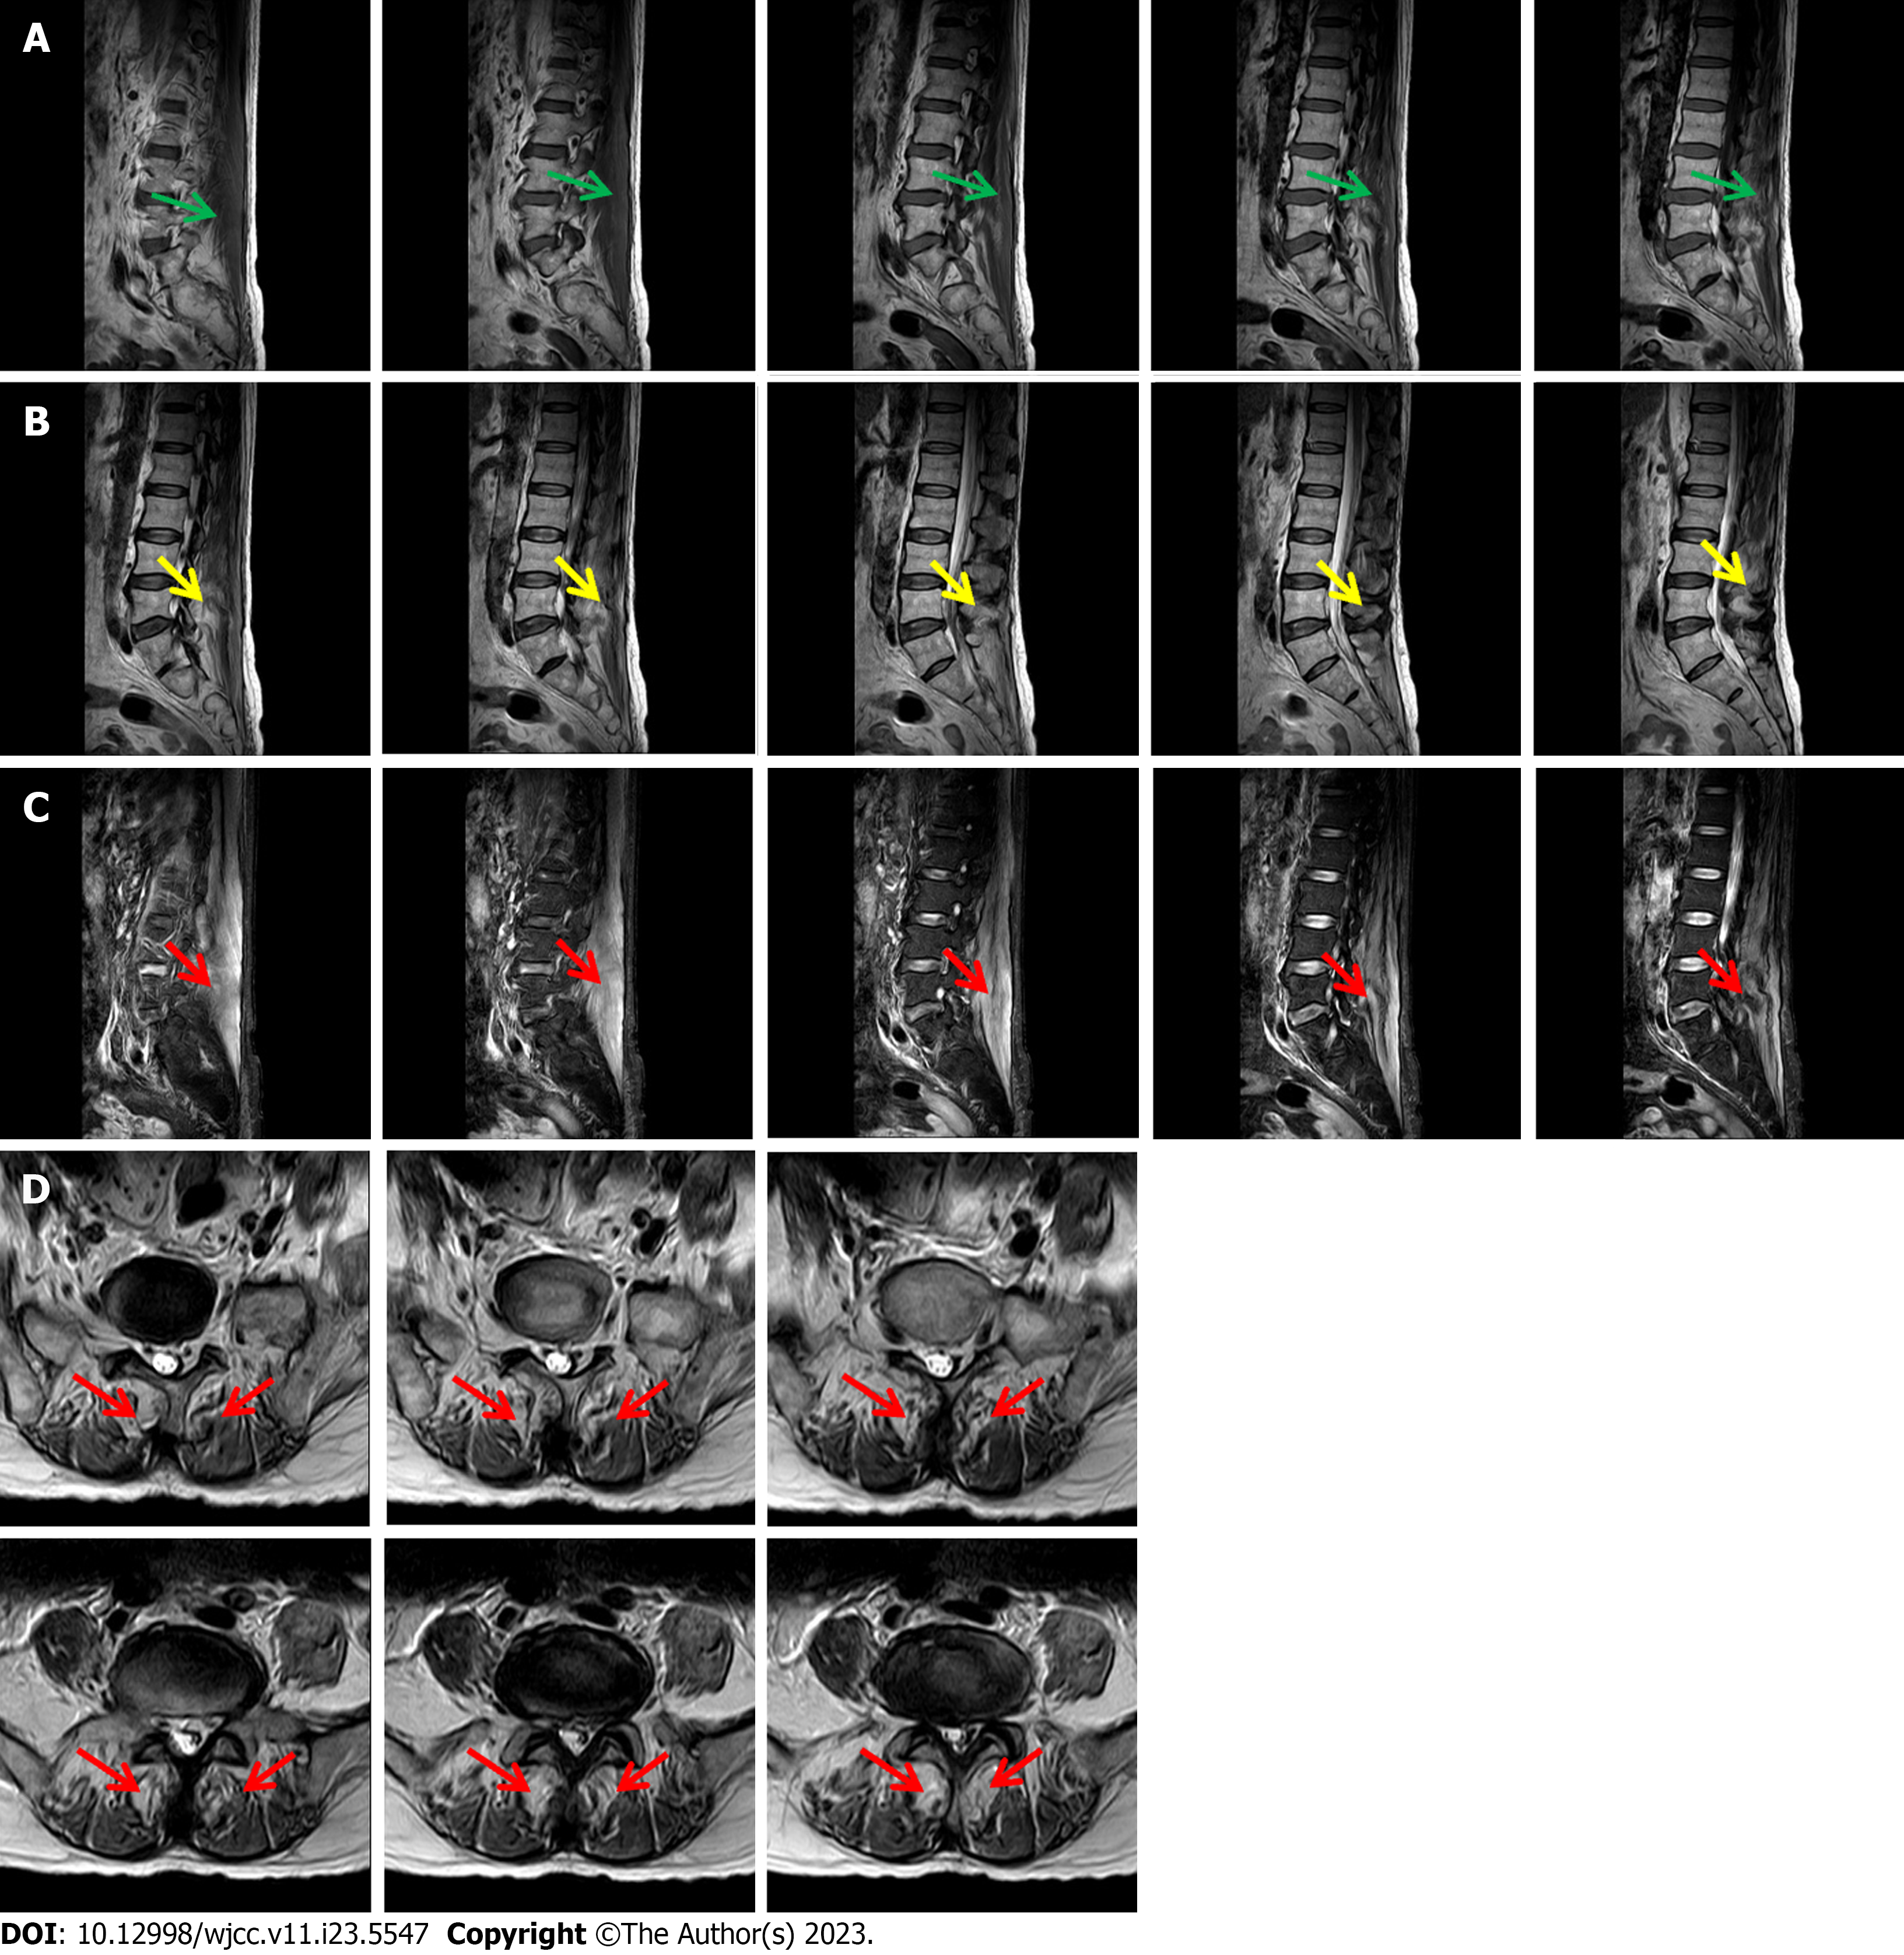
Figure 2 Magnetic resonance examination.
A: Sagittal T1 weighted image showing homogeneously intermediate-to-uneven slightly higher signal intensities involving erector spinae (green arrows); B: Sagittal T2 weighted image showing diffusely increased signal intensities involving erector spinae (yellow arrows); C: Sagittal fat-suppressed T2 weighted image demonstrating diffuse involvement of erector spinae (red arrows); D: Axial fat-suppressed T2 weighted image demonstrating symmetrical incomplete involvement of erector spinae on both sides and patchy signal enhancement (red arrows).
- Citation: Wang YH, Zhang SS, Li HT, Zhi HW, Wu HY. Rhabdomyolysis-induced acute kidney injury after administration of a red yeast rice supplement: A case report. World J Clin Cases 2023; 11(23): 5547-5553
- URL: https://www.wjgnet.com/2307-8960/full/v11/i23/5547.htm
- DOI: https://dx.doi.org/10.12998/wjcc.v11.i23.5547


