Copyright
©The Author(s) 2023.
World J Clin Cases. Jul 16, 2023; 11(20): 4852-4864
Published online Jul 16, 2023. doi: 10.12998/wjcc.v11.i20.4852
Published online Jul 16, 2023. doi: 10.12998/wjcc.v11.i20.4852
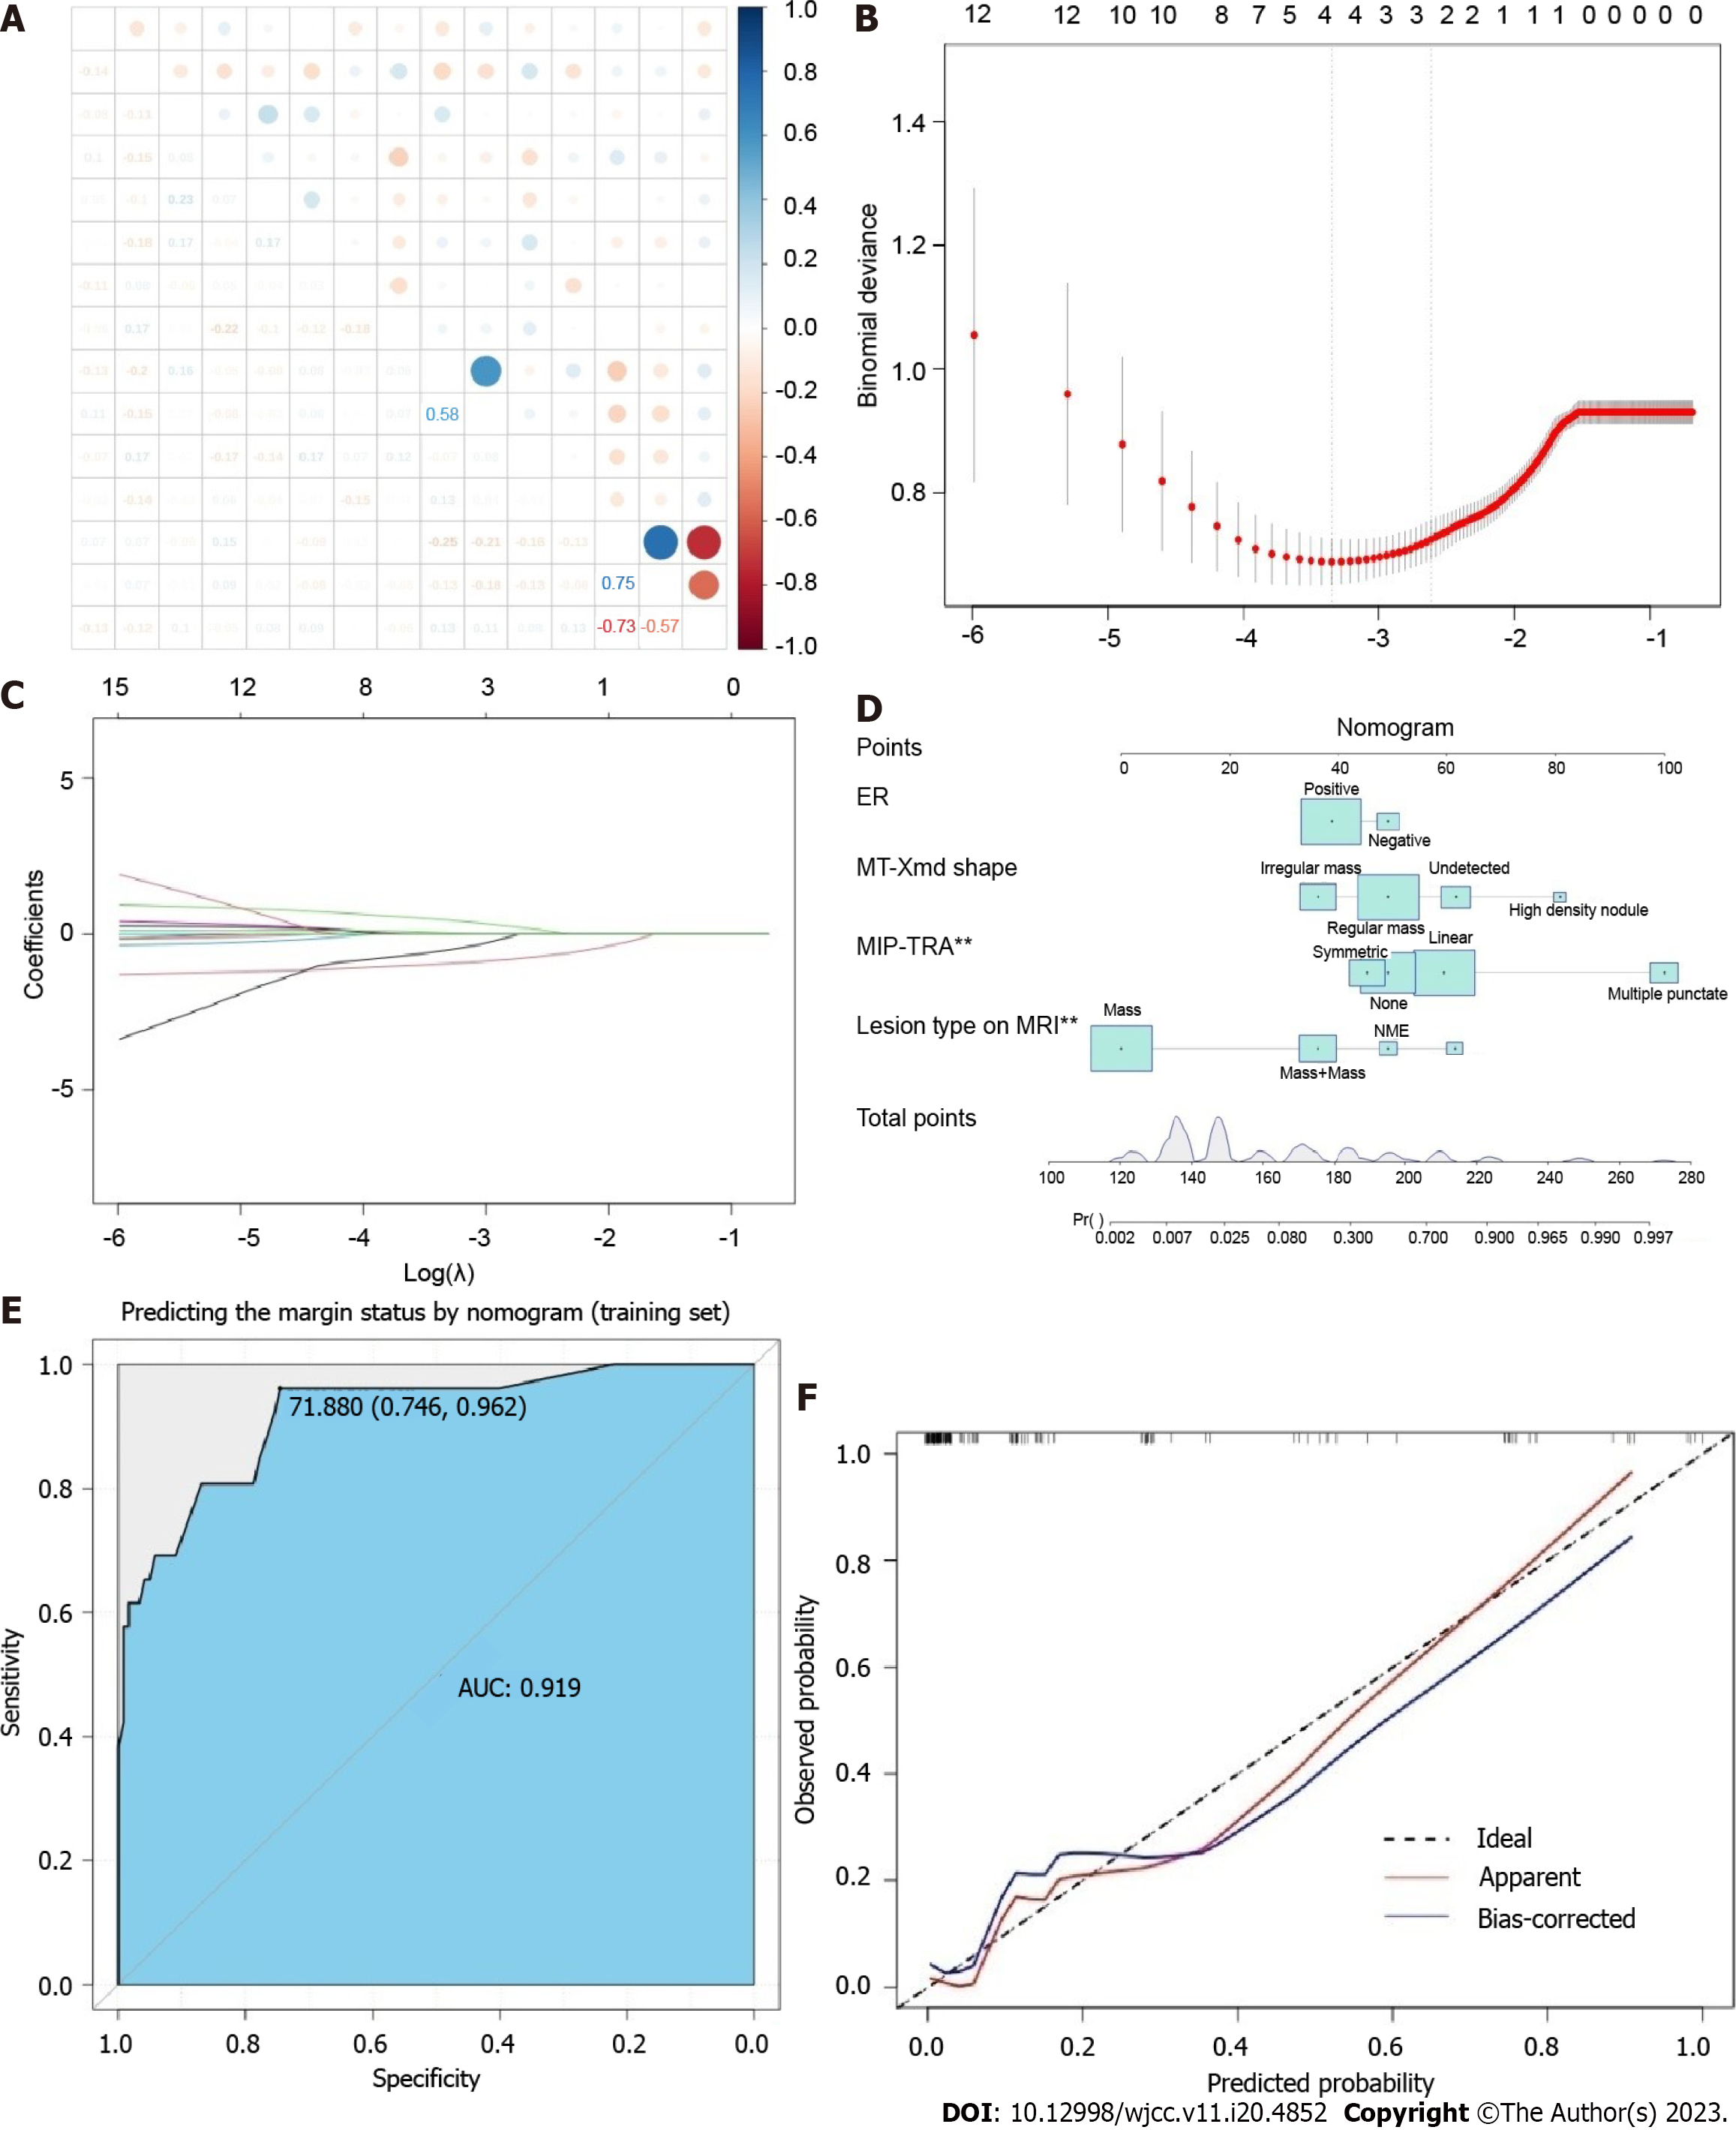
Figure 2 Selected predictive factors and predicted negative margins.
A: The "stata" software package determined the presence of multicollinearity among the factors influencing negative margins; B: The best parameter (λ) was selected in the LASSO model, and a vertical dashed line was drawn at the optimal value. The red dot represents the target variable for each λ, and two dashed lines represent special λ values; C: From the 12 identified non-zero coefficient influencing factors, each curve represents the trajectory of one factor's change. The vertical axis is the value of the coefficient, the horizontal axis below is log (λ), and the horizontal axis above is the number of non-zero coefficients in the model at this time; D: Column line chart prediction model for predicting negative margins; E: Column line receiver operating characteristic curve for predicting negative margins in the training cohort; F: Internal validation calibration curve for the training set. MIP: Maximal intensity projection; NME: Non-mass enhancement.
- Citation: Liu P, Zhao Y, Rong DD, Li KF, Wang YJ, Zhao J, Kang H. Diagnostic value of preoperative examination for evaluating margin status in breast cancer. World J Clin Cases 2023; 11(20): 4852-4864
- URL: https://www.wjgnet.com/2307-8960/full/v11/i20/4852.htm
- DOI: https://dx.doi.org/10.12998/wjcc.v11.i20.4852


