Copyright
©The Author(s) 2023.
World J Clin Cases. Jul 16, 2023; 11(20): 4833-4842
Published online Jul 16, 2023. doi: 10.12998/wjcc.v11.i20.4833
Published online Jul 16, 2023. doi: 10.12998/wjcc.v11.i20.4833
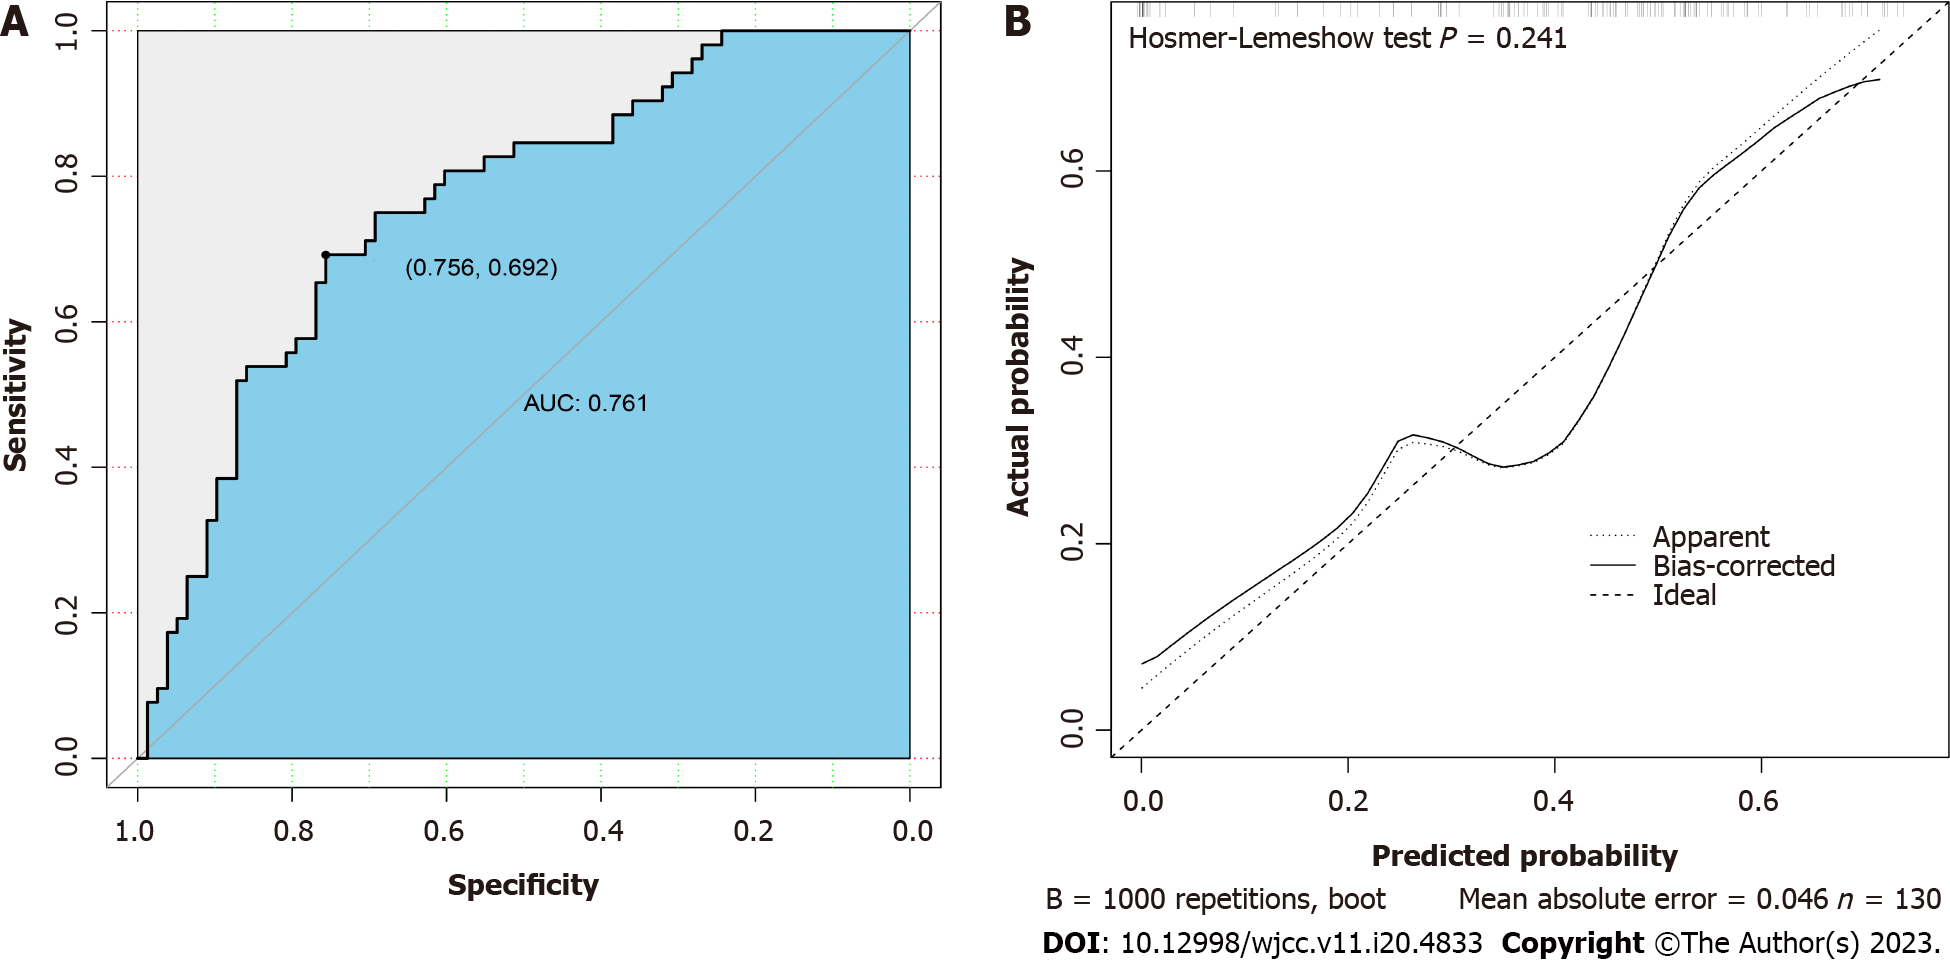
Figure 2 Validation of the predictive model by receiver operating characteristic curve analysis.
A: Receiver operating characteristic curve and area under the curve of the prediction model. The X-axis represented the specificity, and the Y-axis represented the sensitivity of the model; B: Calibration curve of the prediction model. The X-axis represented the predicted risk of Gram-positive bacterial infection, and the Y-axis represented the actual risk of Gram-positive bacterial infection. AUC: Area under the curve.
- Citation: Zhang W, Chen T, Chen HJ, Chen N, Xing ZX, Fu XY. Risk prediction model for distinguishing Gram-positive from Gram-negative bacteremia based on age and cytokine levels: A retrospective study. World J Clin Cases 2023; 11(20): 4833-4842
- URL: https://www.wjgnet.com/2307-8960/full/v11/i20/4833.htm
- DOI: https://dx.doi.org/10.12998/wjcc.v11.i20.4833


