Copyright
©The Author(s) 2023.
World J Clin Cases. Jul 16, 2023; 11(20): 4763-4787
Published online Jul 16, 2023. doi: 10.12998/wjcc.v11.i20.4763
Published online Jul 16, 2023. doi: 10.12998/wjcc.v11.i20.4763
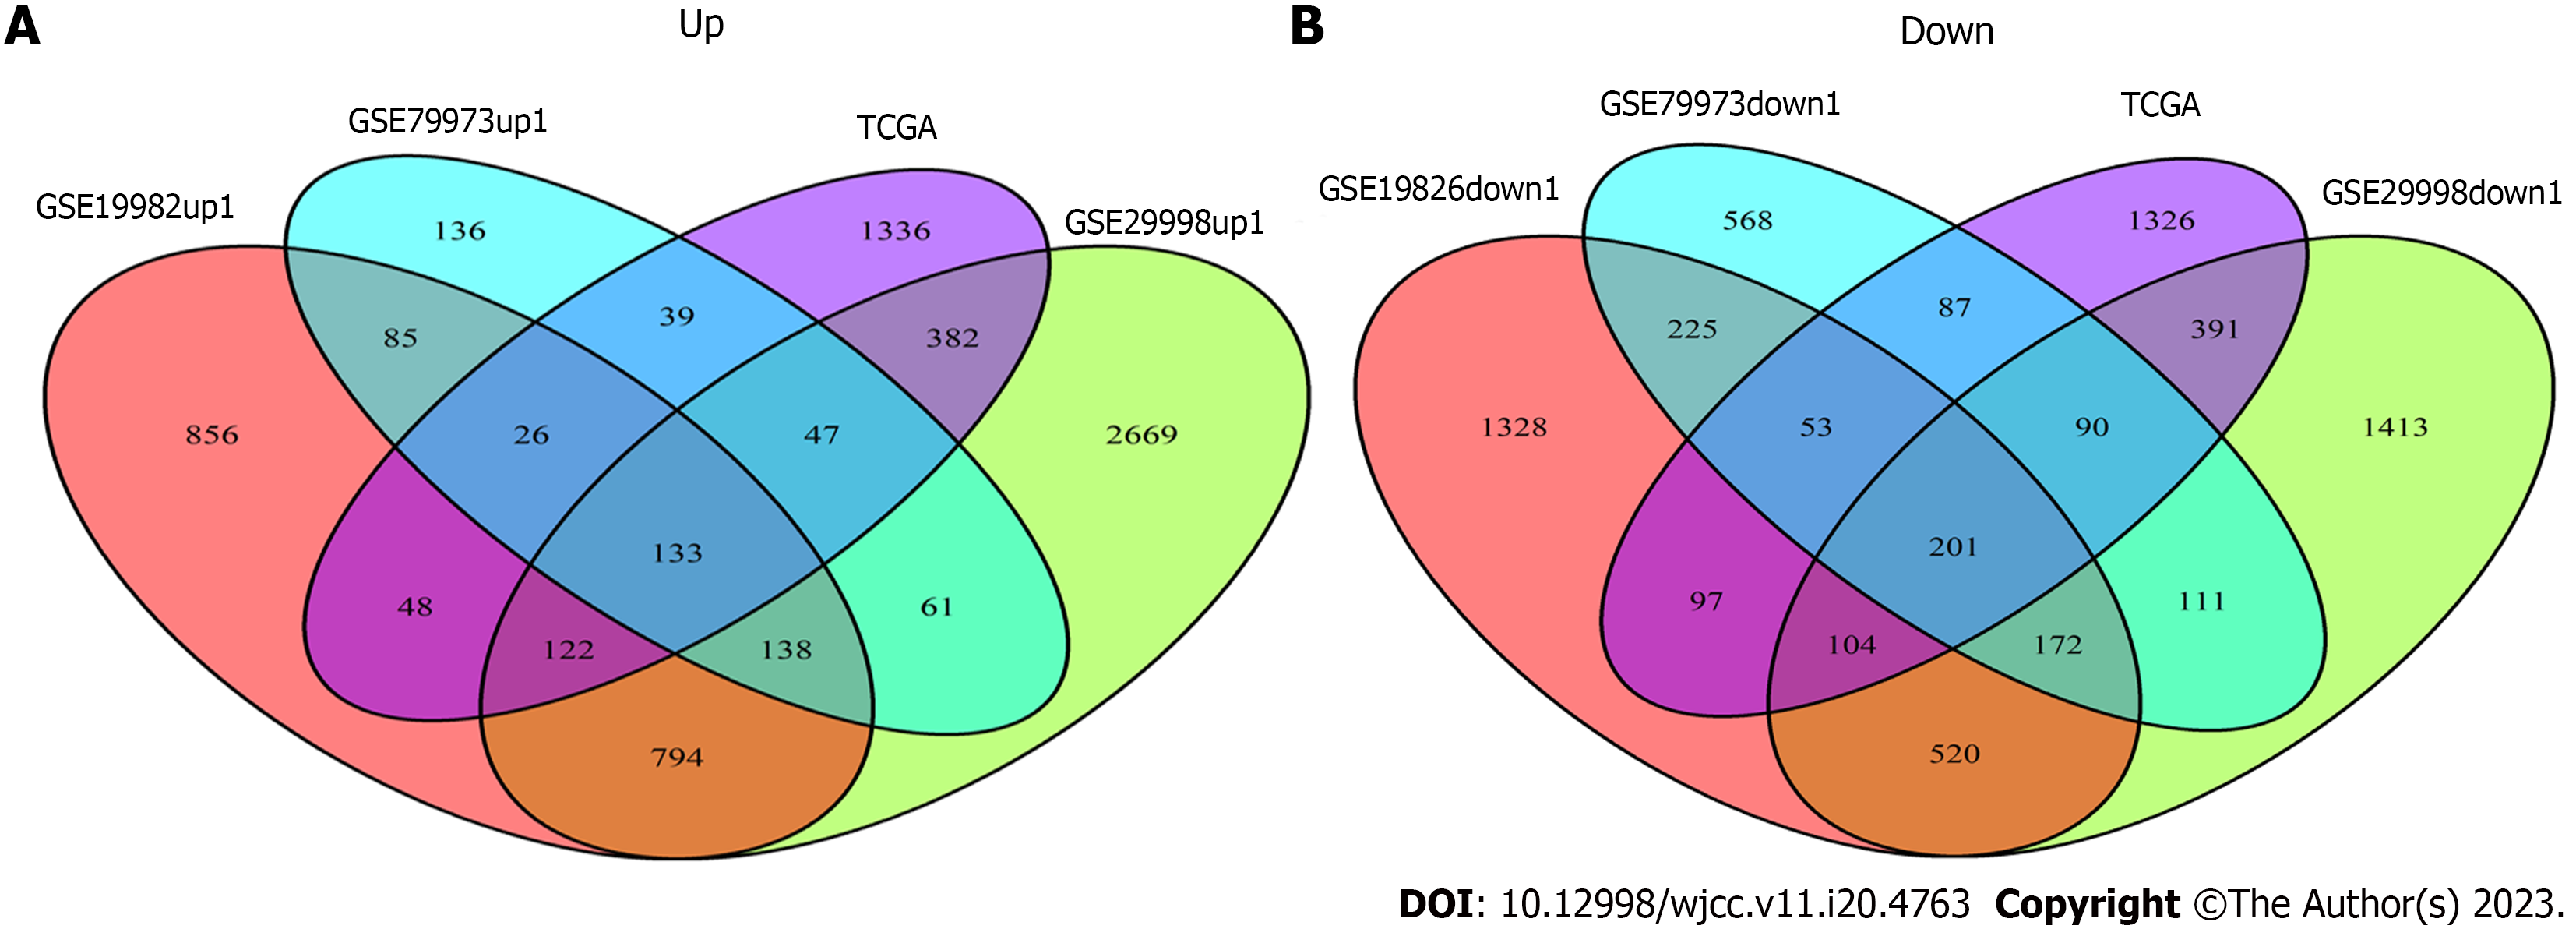
Figure 3 The Venn analysis of differentially expressed genes from Gene Expression Omnibus and The Cancer Genome Atlas datasets.
A: The Venn diagram of GSE19826 (red) 2202 up-regulated genes, GSE79973 (blue) 665 up-regulated genes, GSE29998 (green) 4346 up-regulated genes, The Cancer Genome Atlas (TCGA)-STad (purple) 2133 up-regulated genes, among which 133 genes intersect; B: The Venn diagram of GSE19826 (red) 2700 down-regulated genes, GSE79973 (blue) 1507 down-regulated genes, GSE29998 (green) 3002 down-regulated genes, TCGA-STad (purple) 2349 down-regulated genes, among which 201 genes intersect. TCGA: The Cancer Genome Atlas.
- Citation: Yin LK, Yuan HY, Liu JJ, Xu XL, Wang W, Bai XY, Wang P. Identification of survival-associated biomarkers based on three datasets by bioinformatics analysis in gastric cancer. World J Clin Cases 2023; 11(20): 4763-4787
- URL: https://www.wjgnet.com/2307-8960/full/v11/i20/4763.htm
- DOI: https://dx.doi.org/10.12998/wjcc.v11.i20.4763


