Copyright
©The Author(s) 2023.
World J Clin Cases. Jul 6, 2023; 11(19): 4553-4566
Published online Jul 6, 2023. doi: 10.12998/wjcc.v11.i19.4553
Published online Jul 6, 2023. doi: 10.12998/wjcc.v11.i19.4553
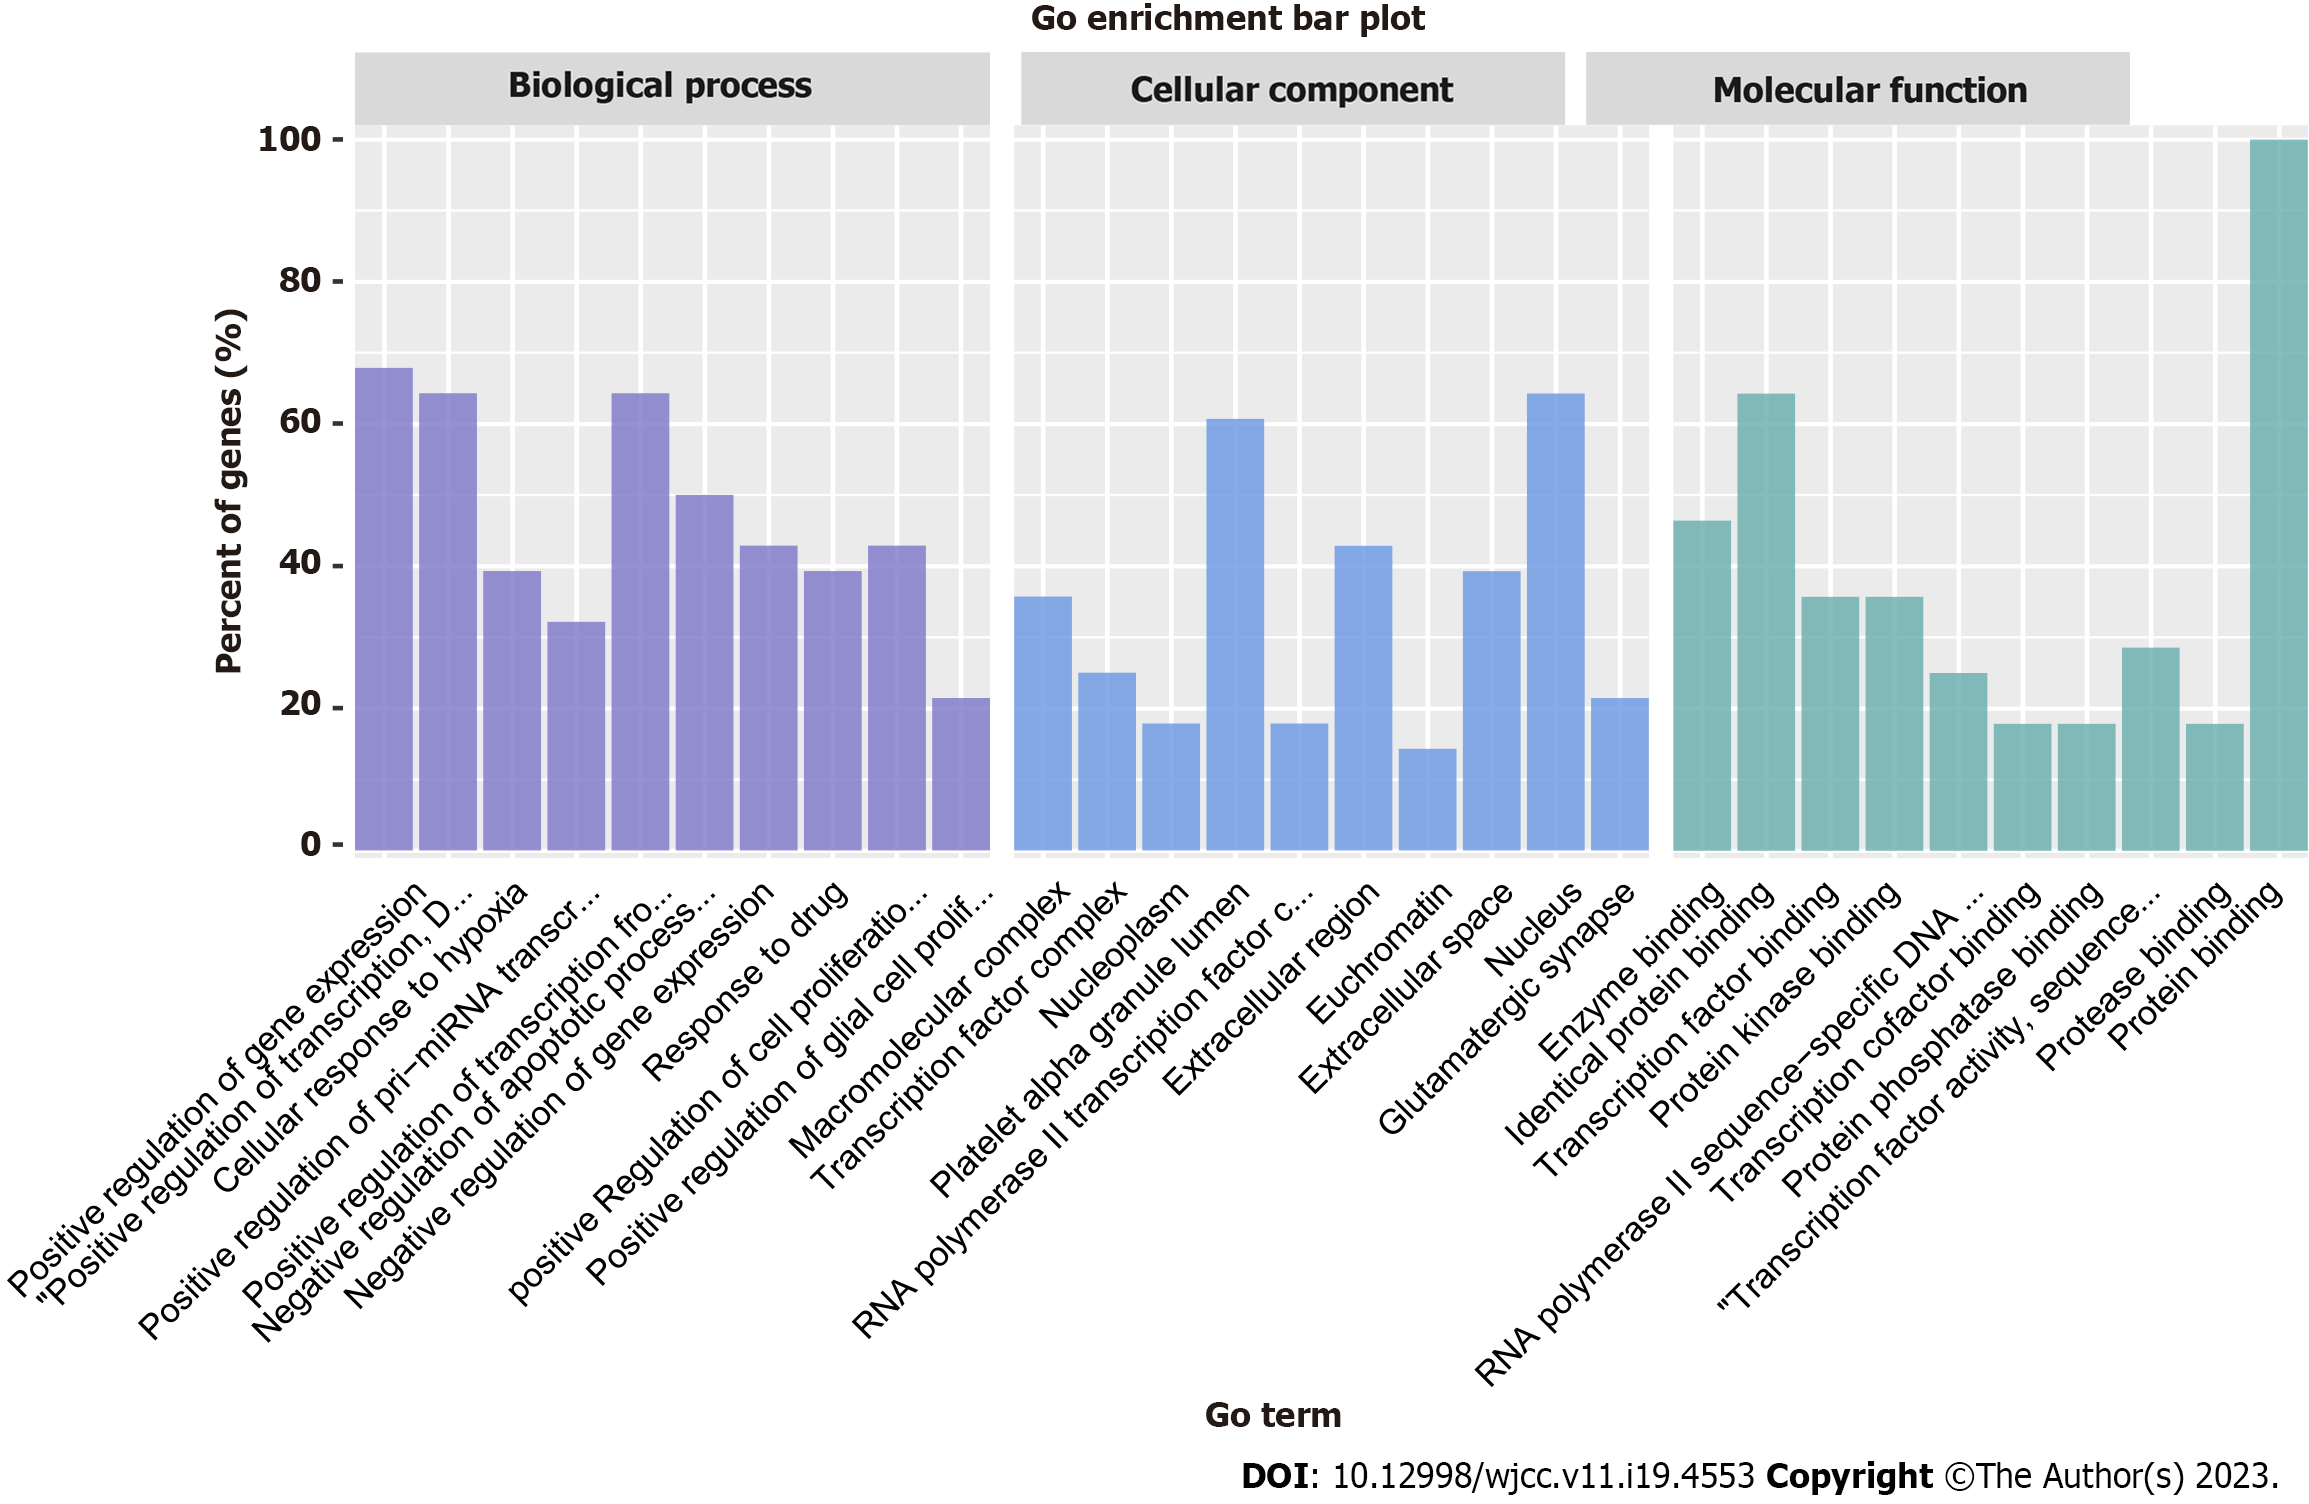
Figure 4 Gene ontology functional enrichment analysis.
The purple bars represent biological processes, the blue bars represent cellular components, and the green bars represent molecular functions. GO: Gene ontology.
- Citation: Li YJ, Tang DX, Yan HT, Yang B, Yang Z, Long FX. Network pharmacology and molecular docking-based analyses to predict the potential mechanism of Huangqin decoction in treating colorectal cancer. World J Clin Cases 2023; 11(19): 4553-4566
- URL: https://www.wjgnet.com/2307-8960/full/v11/i19/4553.htm
- DOI: https://dx.doi.org/10.12998/wjcc.v11.i19.4553


