Copyright
©The Author(s) 2023.
World J Clin Cases. Jun 16, 2023; 11(17): 4105-4116
Published online Jun 16, 2023. doi: 10.12998/wjcc.v11.i17.4105
Published online Jun 16, 2023. doi: 10.12998/wjcc.v11.i17.4105
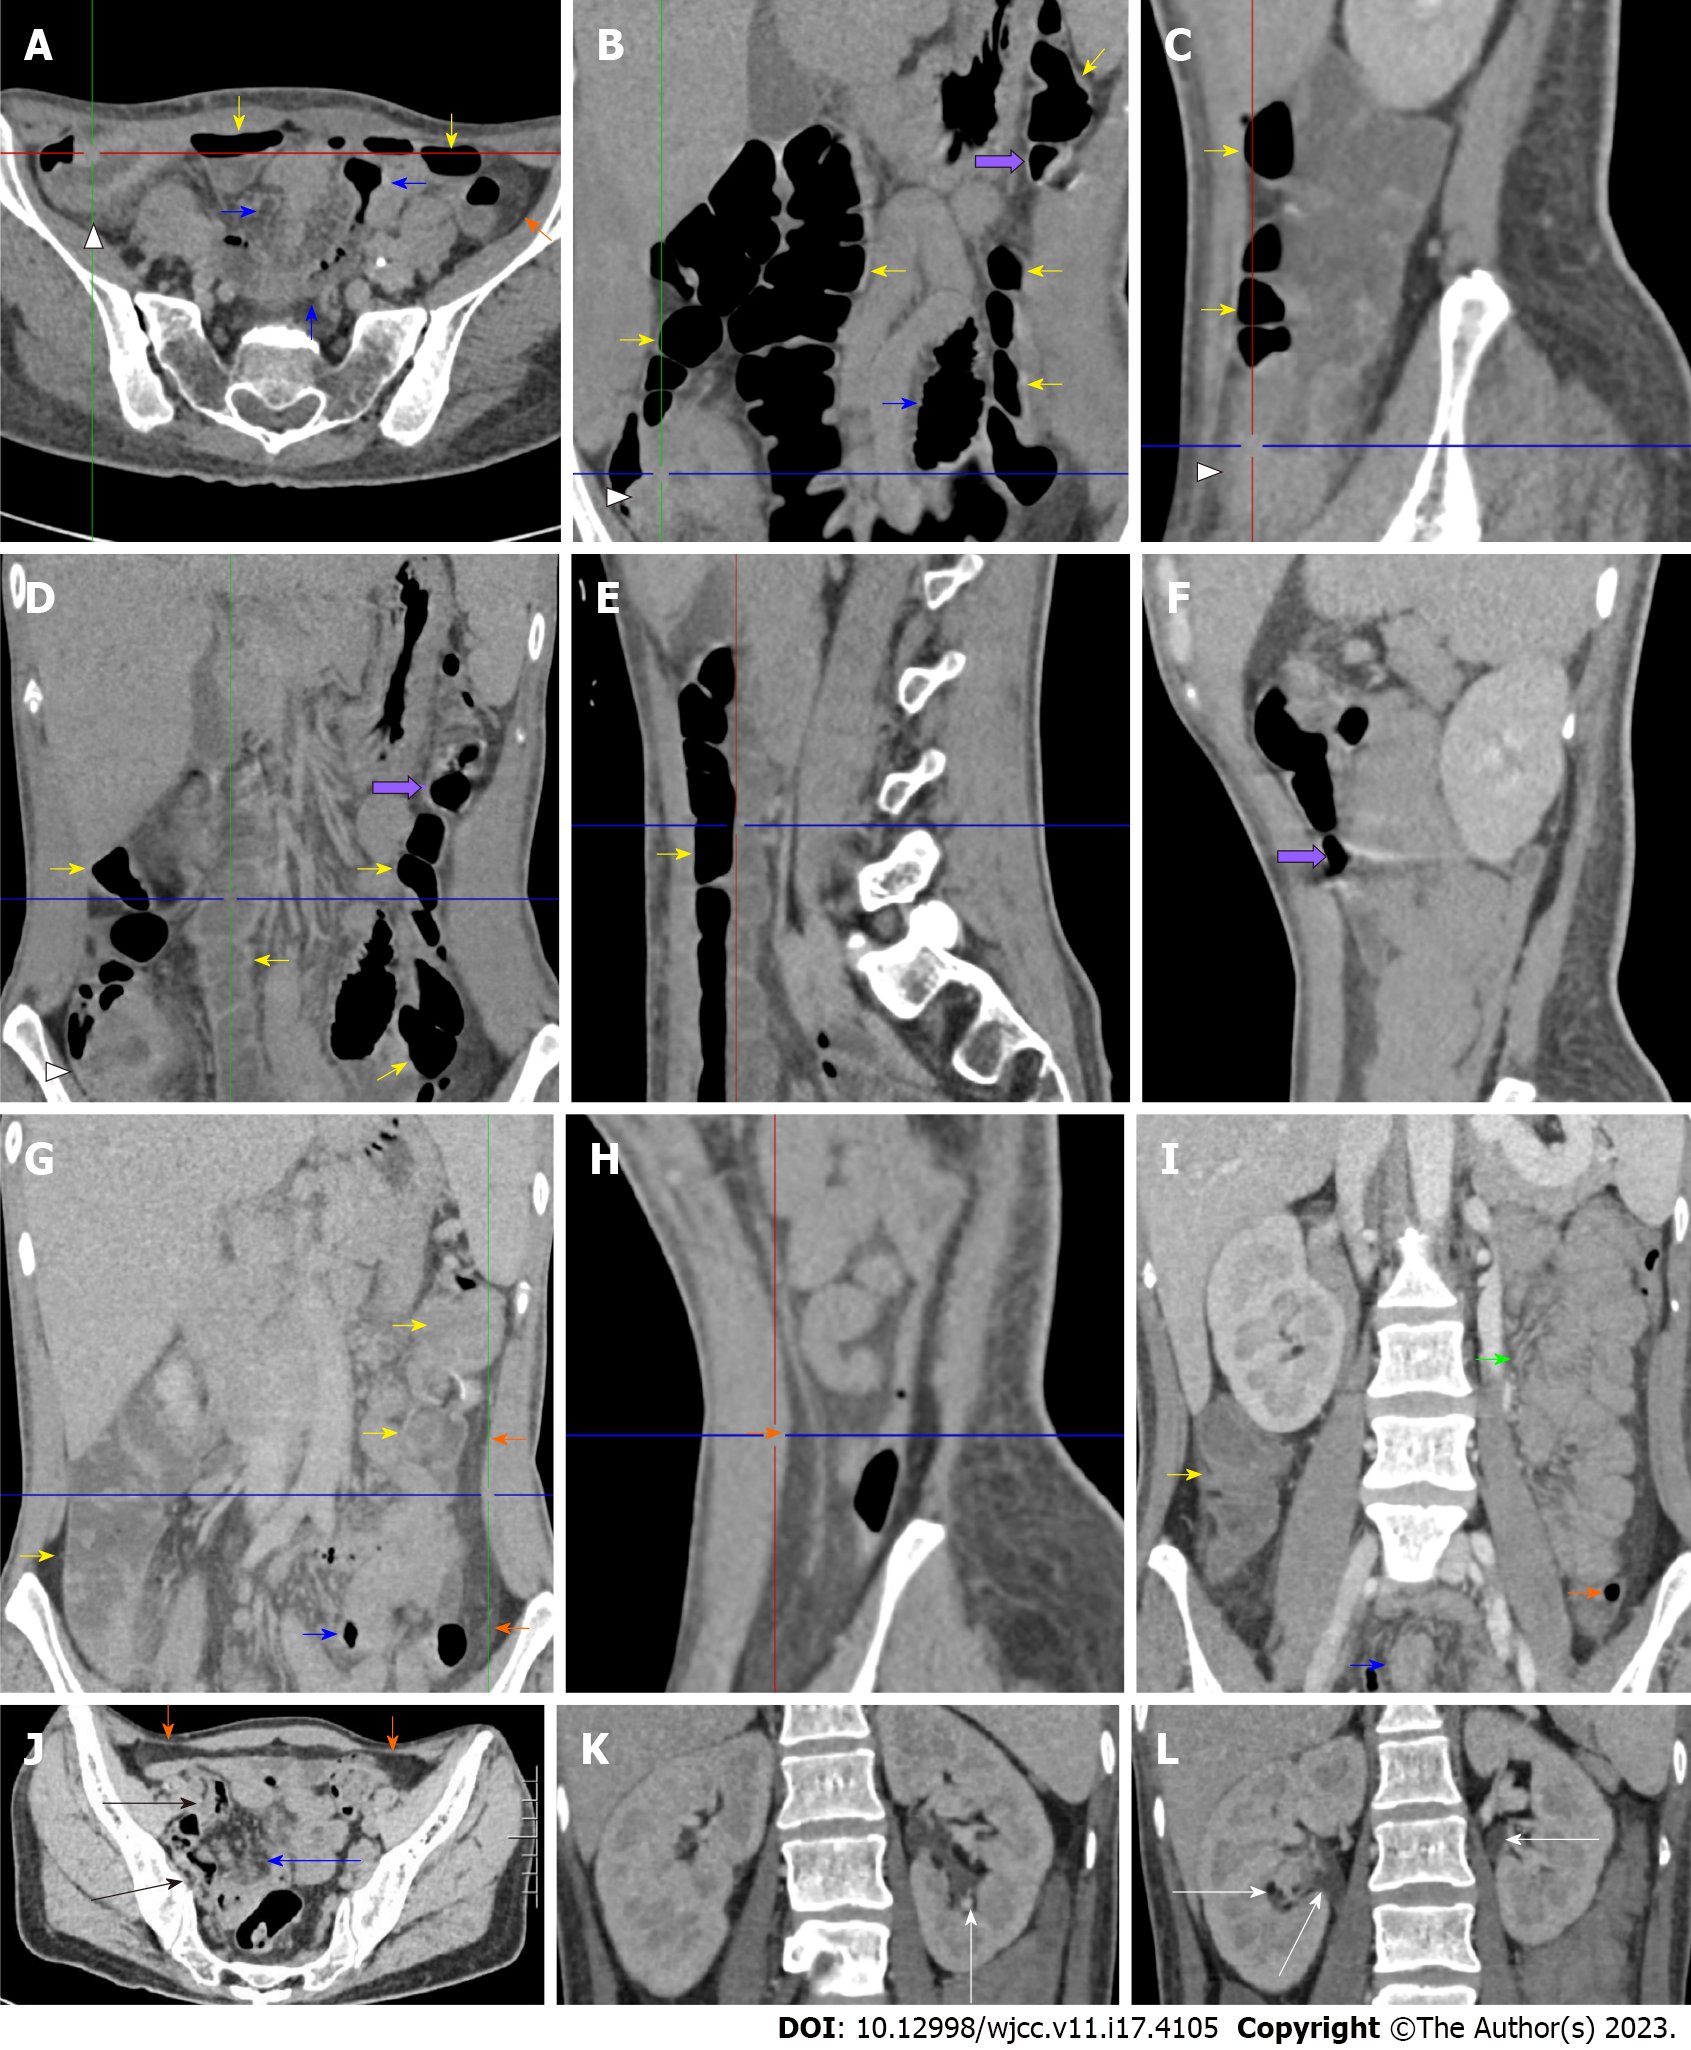
Figure 3 Enhanced abdominal computed tomography in the flared inflammatory episode.
The computed tomography (CT) scan was performed after bowel preparation. A-C: Striking bowel wall thickening with mucosal hyperenhancement, mucosal hyperdensity and circumferentially distributed hypervascular fat stranding of the cecum in the right iliac fossa in the absence of mural stratification was readily visualized (head arrows). From the ascending colon to the splenic flexure, the mucosa was hyperenhanced and hyperdense, and the lumen was dilated with successional gas-liquid levels (yellow arrows), suggesting the fibrotic thickening of the colonic wall and the presence of dynamic abnormalities. Noticeably, the location of the transverse colon was abnormally low, which may represent a visceral ectopia and may affect colonic function. However, the descending colon was collapsed following a segment of hypertrophic lesions in the splenic flexure, and in some segments, was emptied. In a short segment of the sigmoid colon (blue arrows), the mucosa was hypertrophic, and the lumen was dilated. Proximal and distal to the dilated segment of the sigmoid colon, the colonic wall was hypertrophic, and the lumen was collapsed; D and E: Successional gas-liquid levels in the descending part of the transverse colon; F: A segment of hyperenhanced mucosa and hypertrophic wall with erosive lesions was present in the ascending part of the transverse colon (purple arrows). These hypertrophic lesions could also be seen in multiple colonic and enteric segments; G and H: A misty fat streak on both the visceral and parietal sides of the thickened peritoneum of the left abdominal wall (orange arrows) was visualized along the ascending part of the transverse colon, indicating the peritoneal involvement of inflammatory lesions. An inflamed diverticulum was present in the distal descending colon, and the fat streak was especially prominent adjacent to this colonic segment; I: A large segment of clustered and adhered bowel loop was present in the jejunum (green arrow), together with fibrotic thickening of the peritoneum forming a so-called “abdominal cocoon”. Clustered perienteric hypervascular fat stranding was adjacent to this adhesive jejunal loop. This clustered perienteric hypervascular fat stranding could also been visualized in other enteric segments (blue arrows); J: The fat streak was contiguous with the fat stranding of the right iliac fossa posterior to the anterior abdominal wall at the pelvic level (orange arrows). The wall of the distal ileum was hypertrophic, and the lumen was gas-filled (black arrows); K and L: Hydronephrosis was present in the bilateral pelvises (white arrows), and hypertrophic lesions could be visualized. These imaging features, together with the imaging presentation on chest CT, strongly suggested a diagnosis of tuberculosis reactivation involving the gastrointestinal tract, peritoneum and pelvises.
- Citation: Ju B, Xiu NN, Xu J, Yang XD, Sun XY, Zhao XC. Flared inflammatory episode transforms advanced myelodysplastic syndrome into aplastic pancytopenia: A case report and literature review. World J Clin Cases 2023; 11(17): 4105-4116
- URL: https://www.wjgnet.com/2307-8960/full/v11/i17/4105.htm
- DOI: https://dx.doi.org/10.12998/wjcc.v11.i17.4105


