Copyright
©The Author(s) 2023.
World J Clin Cases. May 26, 2023; 11(15): 3444-3456
Published online May 26, 2023. doi: 10.12998/wjcc.v11.i15.3444
Published online May 26, 2023. doi: 10.12998/wjcc.v11.i15.3444
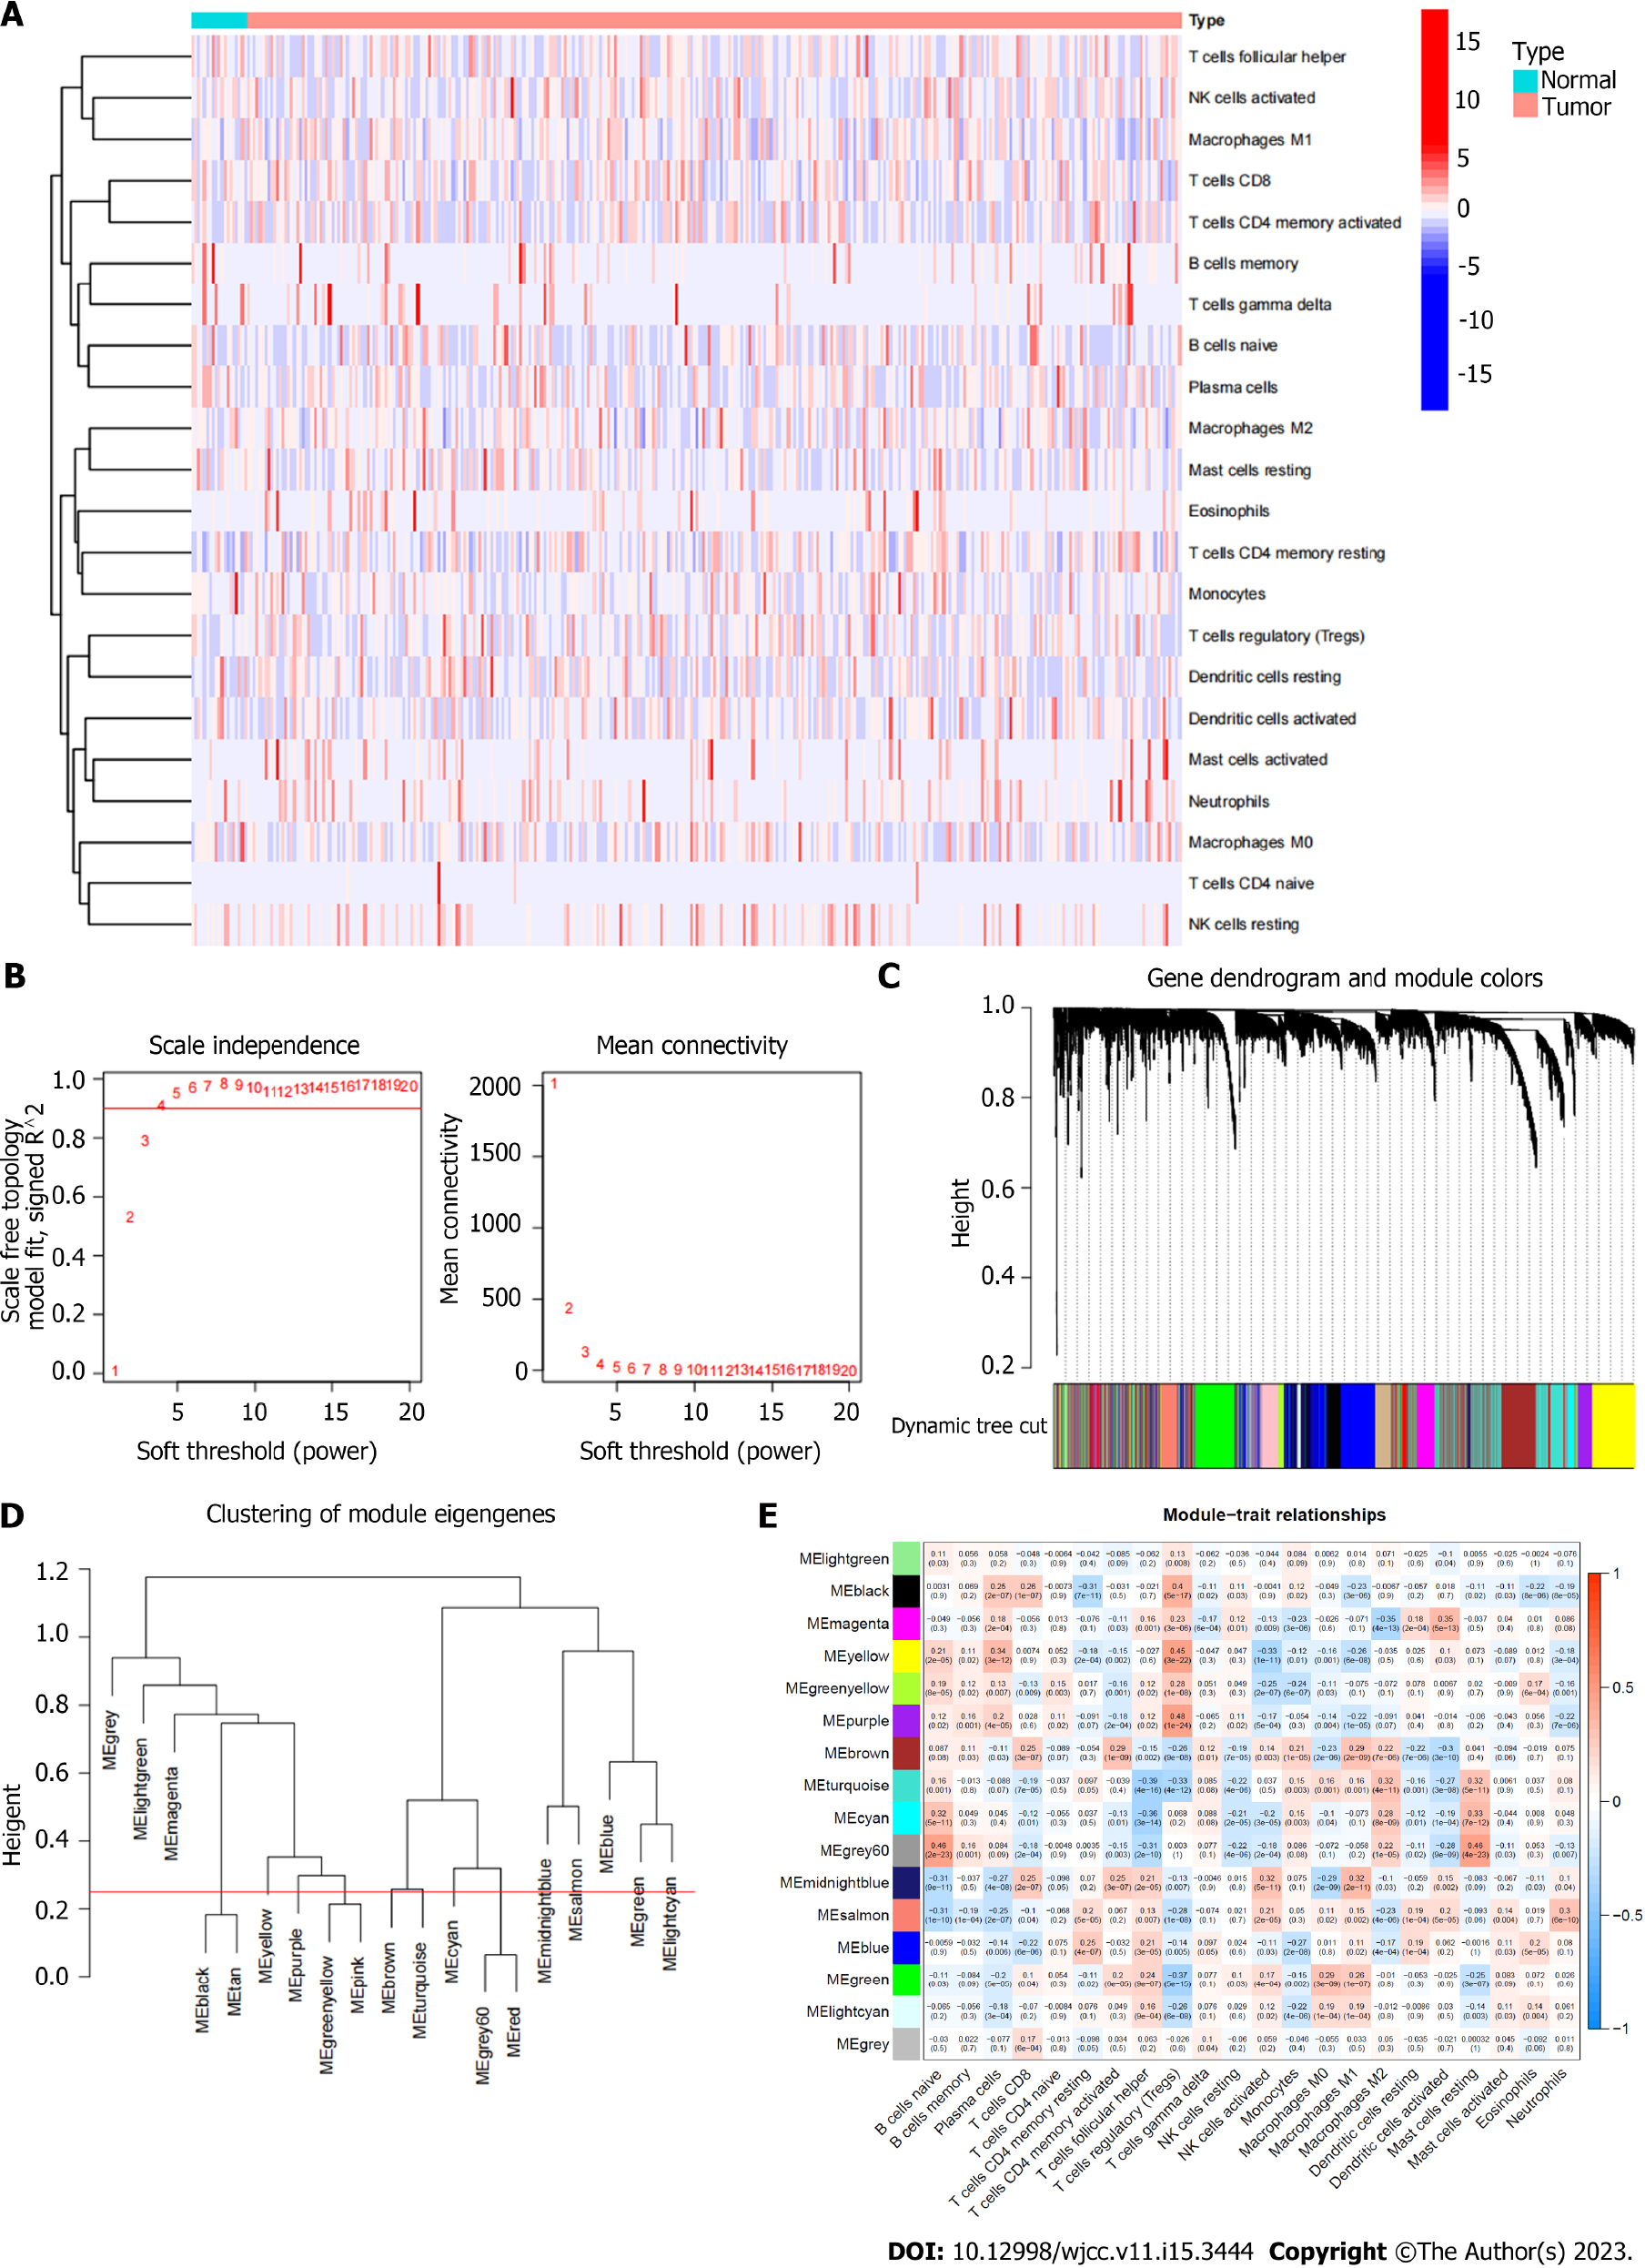
Figure 2 Immune infiltration status of TCGA database samples and gene sets related to immune cell infiltration.
A: Heatmap of the distribution of immune cell infiltration in each sample; B: The scale independence and the mean connectivity; C: Hierarchical clustering was used to obtain coexpressive gene modules; Different gene modules are assigned to different colors; D: Clustering diagram of each gene module; E: Clustering diagram of each gene module.
- Citation: Yang YJ, Xu XQ, Zhang YC, Hu PC, Yang WX. Establishment of a prognostic model related to tregs and natural killer cells infiltration in bladder cancer. World J Clin Cases 2023; 11(15): 3444-3456
- URL: https://www.wjgnet.com/2307-8960/full/v11/i15/3444.htm
- DOI: https://dx.doi.org/10.12998/wjcc.v11.i15.3444


