Copyright
©The Author(s) 2022.
World J Clin Cases. Dec 16, 2022; 10(35): 12959-12970
Published online Dec 16, 2022. doi: 10.12998/wjcc.v10.i35.12959
Published online Dec 16, 2022. doi: 10.12998/wjcc.v10.i35.12959
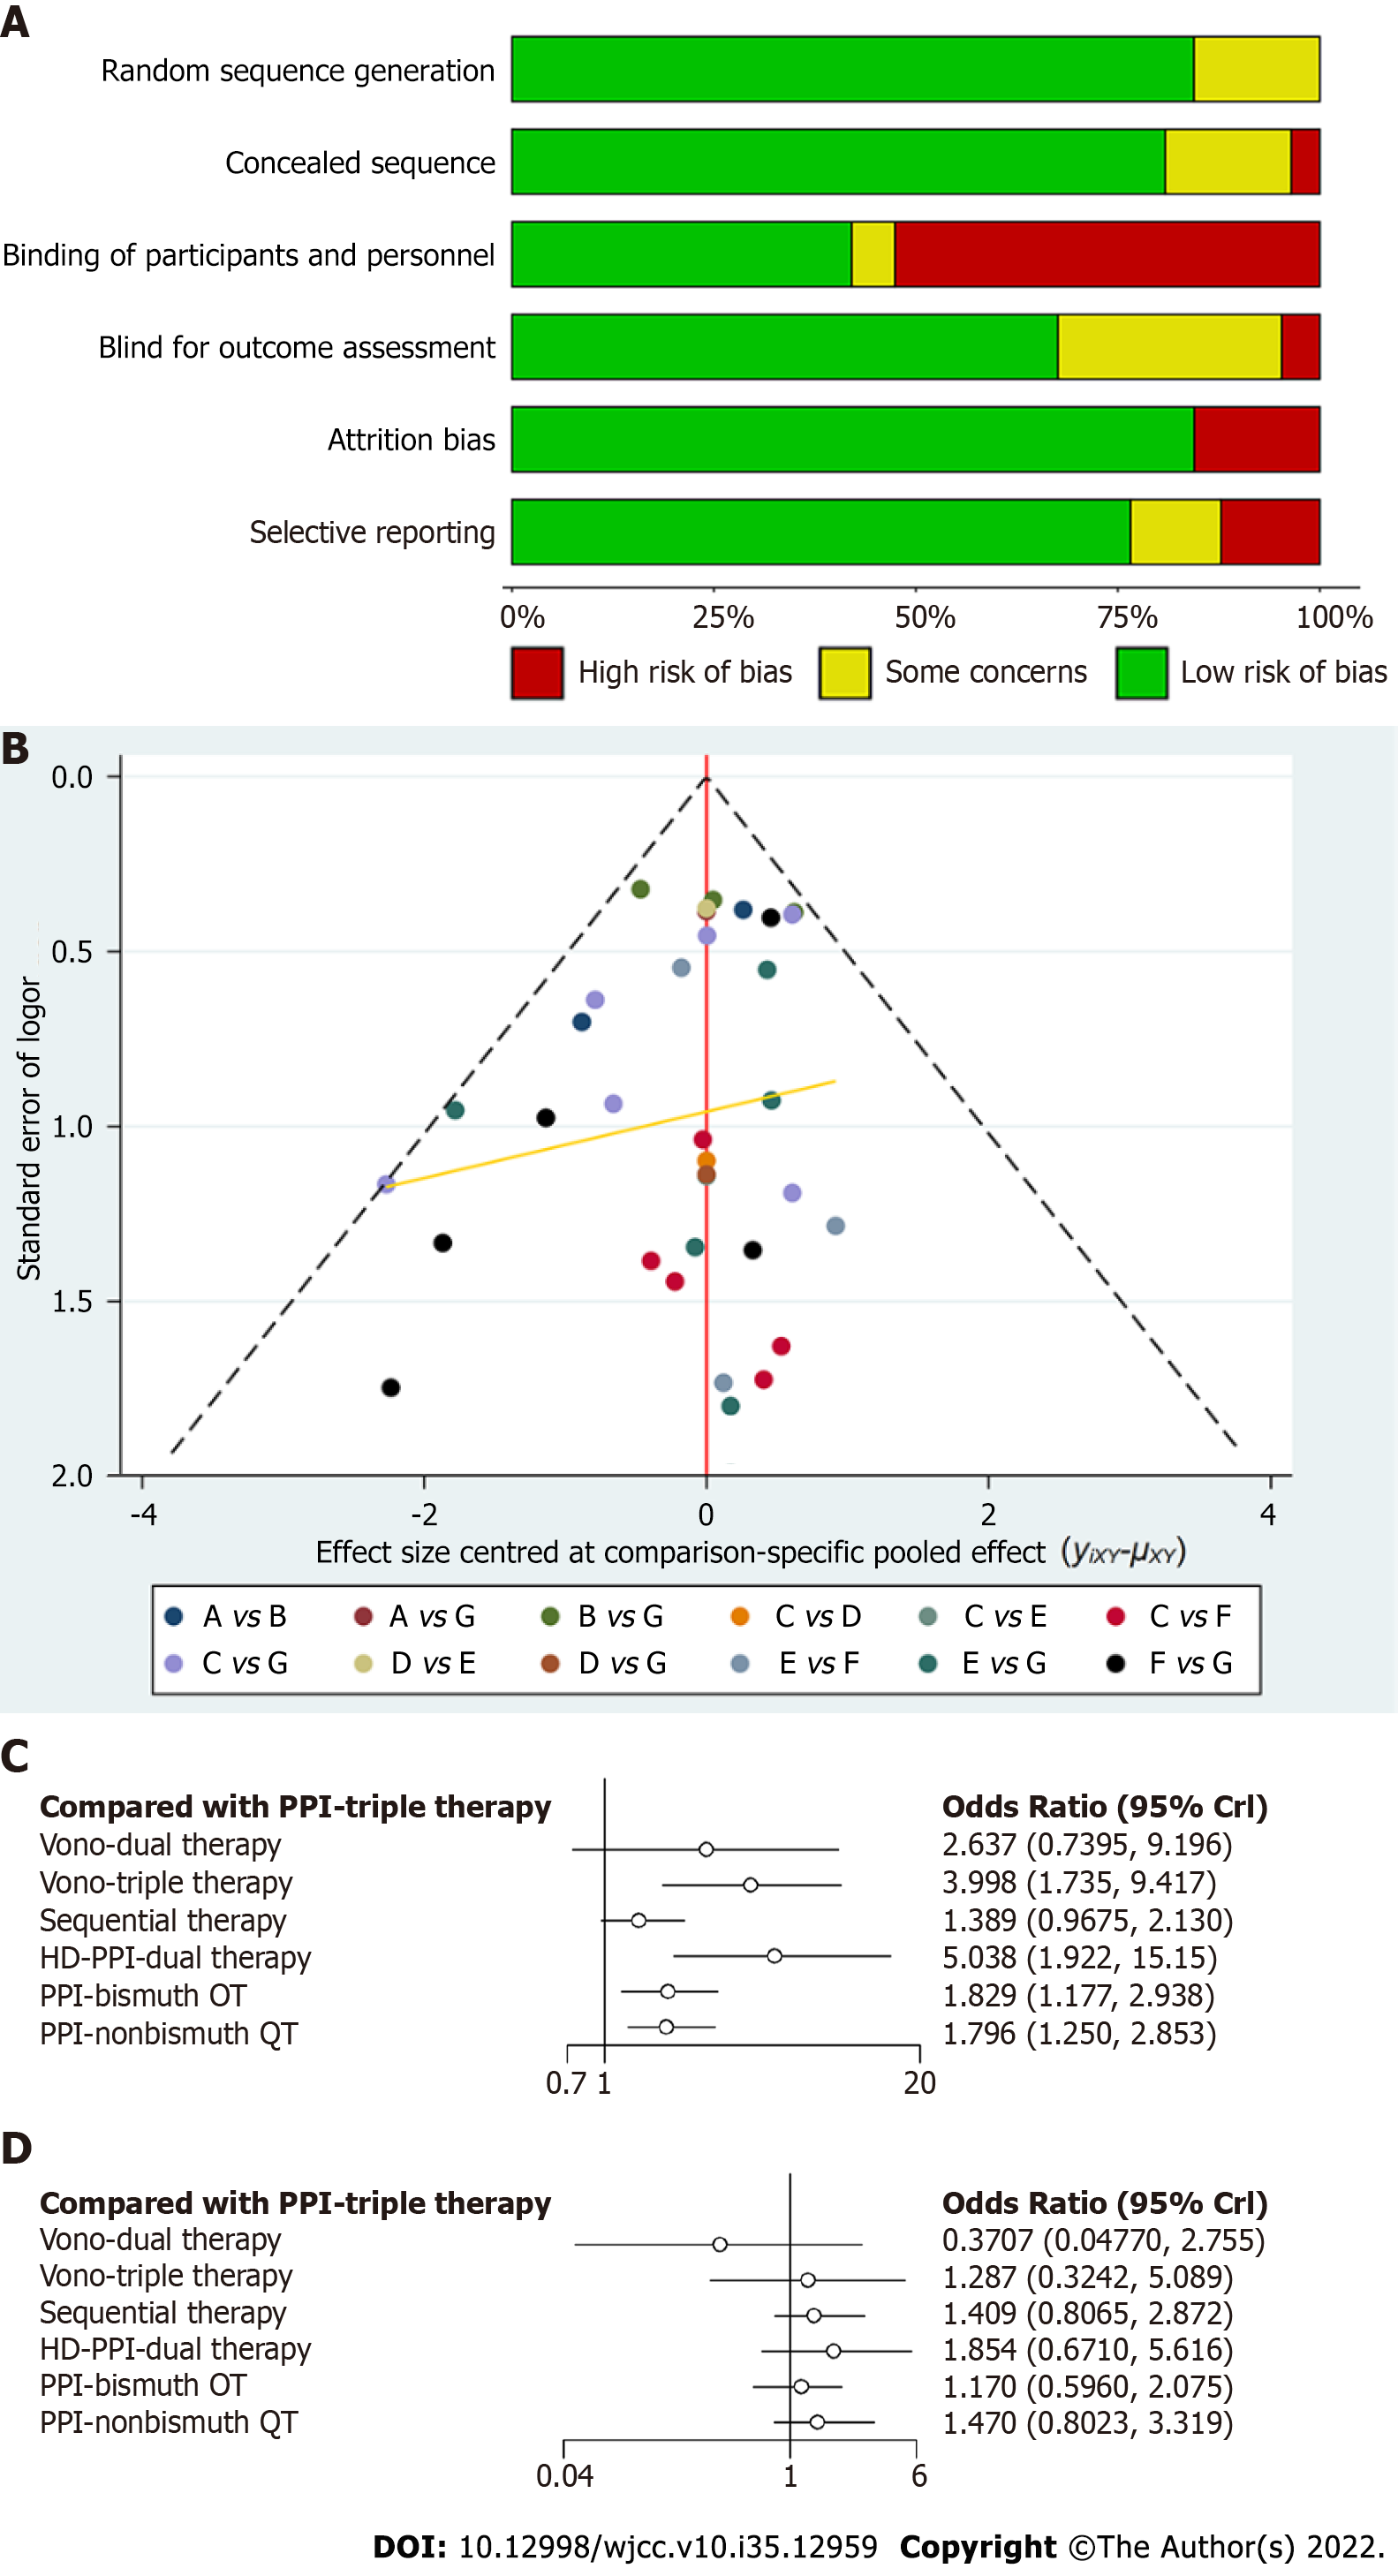
Figure 6 Risk of bias graph and the funnel plot.
A: Risk of bias graph displaying each item as the percentage in all studies; B: Funnel plot. The symmetrical appearance indicates the absence of publication bias or small study effects in the network; C: Network forest plot of all patients (intention-to-treat) in the subgroup with high cure rates (≥ 90%) showing that dual therapy containing a high-dose proton pump inhibitor (HD-PPI) and Vono-based therapy have advantages over PPI-triple therapy; D: Network forest plot of clarithromycin-susceptible H. pylori in the subgroup with high cure rates (≥ 90%) showing that HD-PPI-dual therapy was slightly superior to PPI-triple therapy. CrI: Credible interval; ITT: Intention to treat; Vono: Vonoprazan; PPI: Proton pump inhibitor; HD: High dose; QT: Quadruple therapy.
- Citation: Zou SP, Cheng Q, Feng CY, Xu C, Sun MH. Comparative effectiveness of first-line therapies for eradication of antibiotic-resistant Helicobacter pylori strains: A network meta-analysis. World J Clin Cases 2022; 10(35): 12959-12970
- URL: https://www.wjgnet.com/2307-8960/full/v10/i35/12959.htm
- DOI: https://dx.doi.org/10.12998/wjcc.v10.i35.12959


