Copyright
©The Author(s) 2022.
World J Clin Cases. Nov 26, 2022; 10(33): 12116-12135
Published online Nov 26, 2022. doi: 10.12998/wjcc.v10.i33.12116
Published online Nov 26, 2022. doi: 10.12998/wjcc.v10.i33.12116
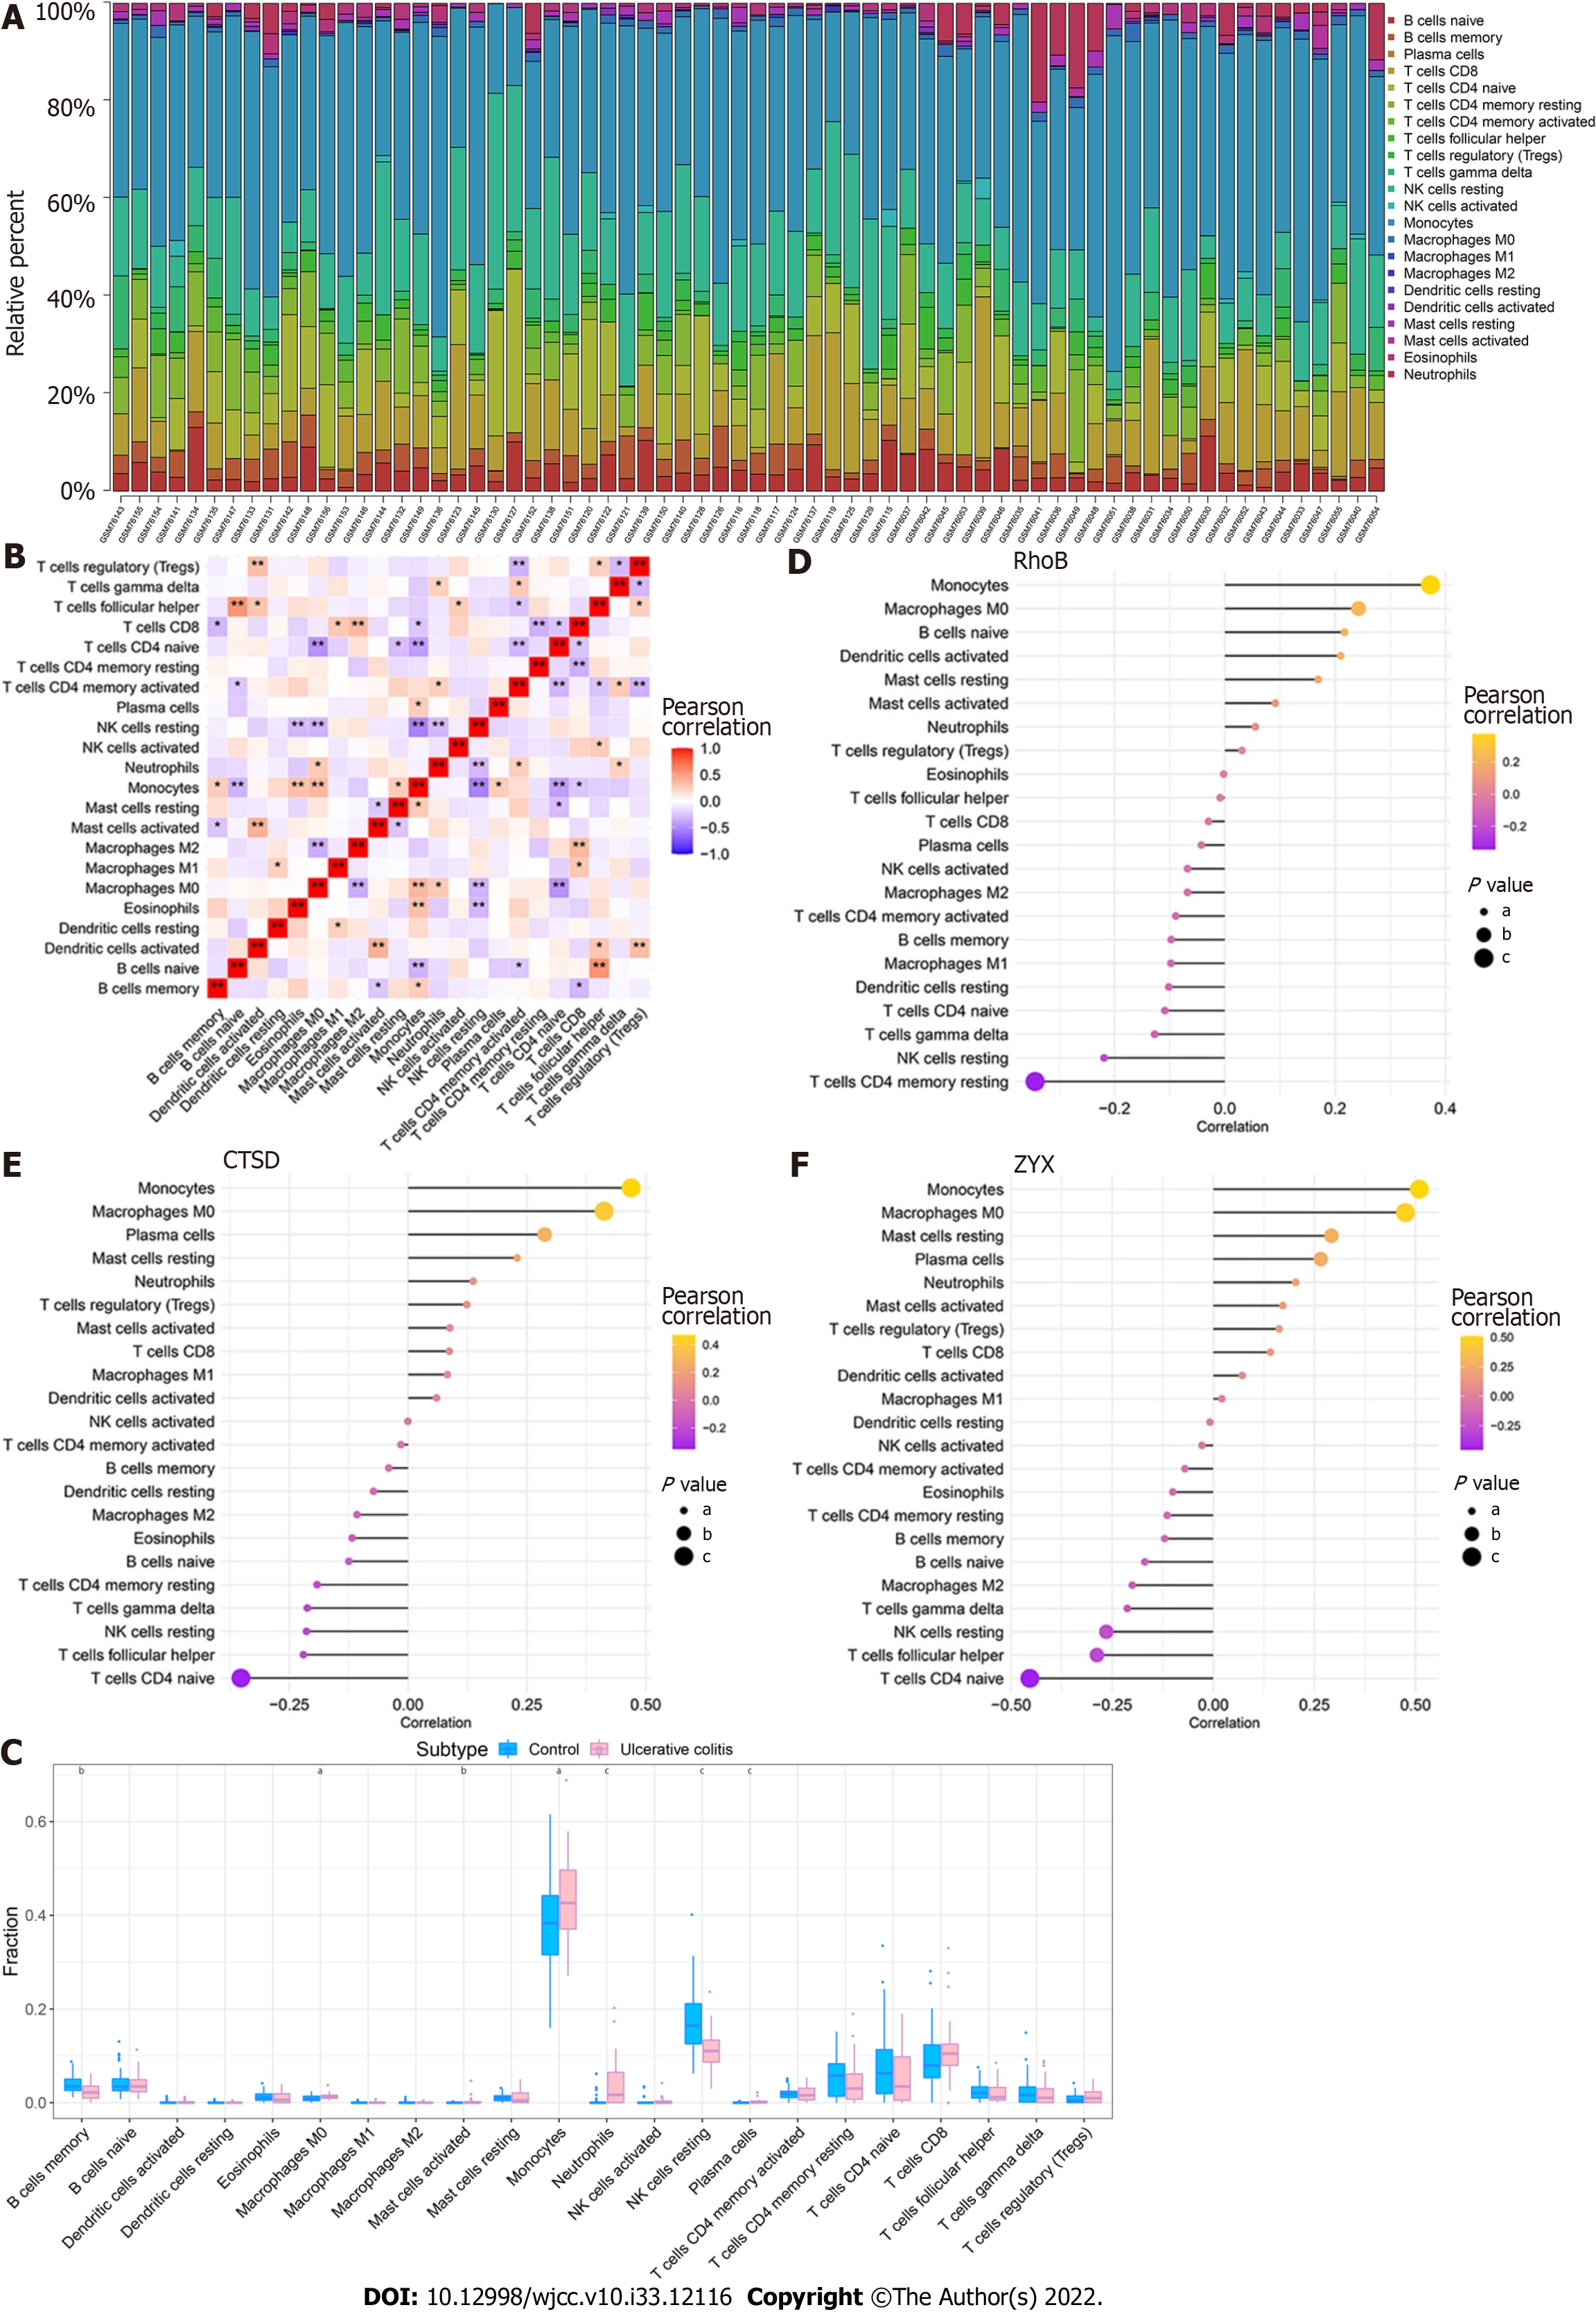
Figure 8 Immune infiltration in patients with ulcerative colitis.
A: Relative percentages of 22 immune cell subsets in ulcerative colitis (UC) samples; B: Pearson correlation among the 22 immune cell types. Blue indicates a positive correlation, and red indicates a positive correlation; C: Differences in the immune cell content between controls and patients with UC. Blue indicates controls, and pink indicates patients with UC. aP < 0.05, bP < 0.01, cP < 0.001; D-F: Pearson correlation analysis of the three core genes with immune cells. Orange indicates a positive correlation, and purple indicates a negative correlation.
- Citation: Dai YC, Qiao D, Fang CY, Chen QQ, Que RY, Xiao TG, Zheng L, Wang LJ, Zhang YL. Single-cell RNA-sequencing combined with bulk RNA-sequencing analysis of peripheral blood reveals the characteristics and key immune cell genes of ulcerative colitis . World J Clin Cases 2022; 10(33): 12116-12135
- URL: https://www.wjgnet.com/2307-8960/full/v10/i33/12116.htm
- DOI: https://dx.doi.org/10.12998/wjcc.v10.i33.12116


