Copyright
©The Author(s) 2022.
World J Clin Cases. Nov 26, 2022; 10(33): 12104-12115
Published online Nov 26, 2022. doi: 10.12998/wjcc.v10.i33.12104
Published online Nov 26, 2022. doi: 10.12998/wjcc.v10.i33.12104
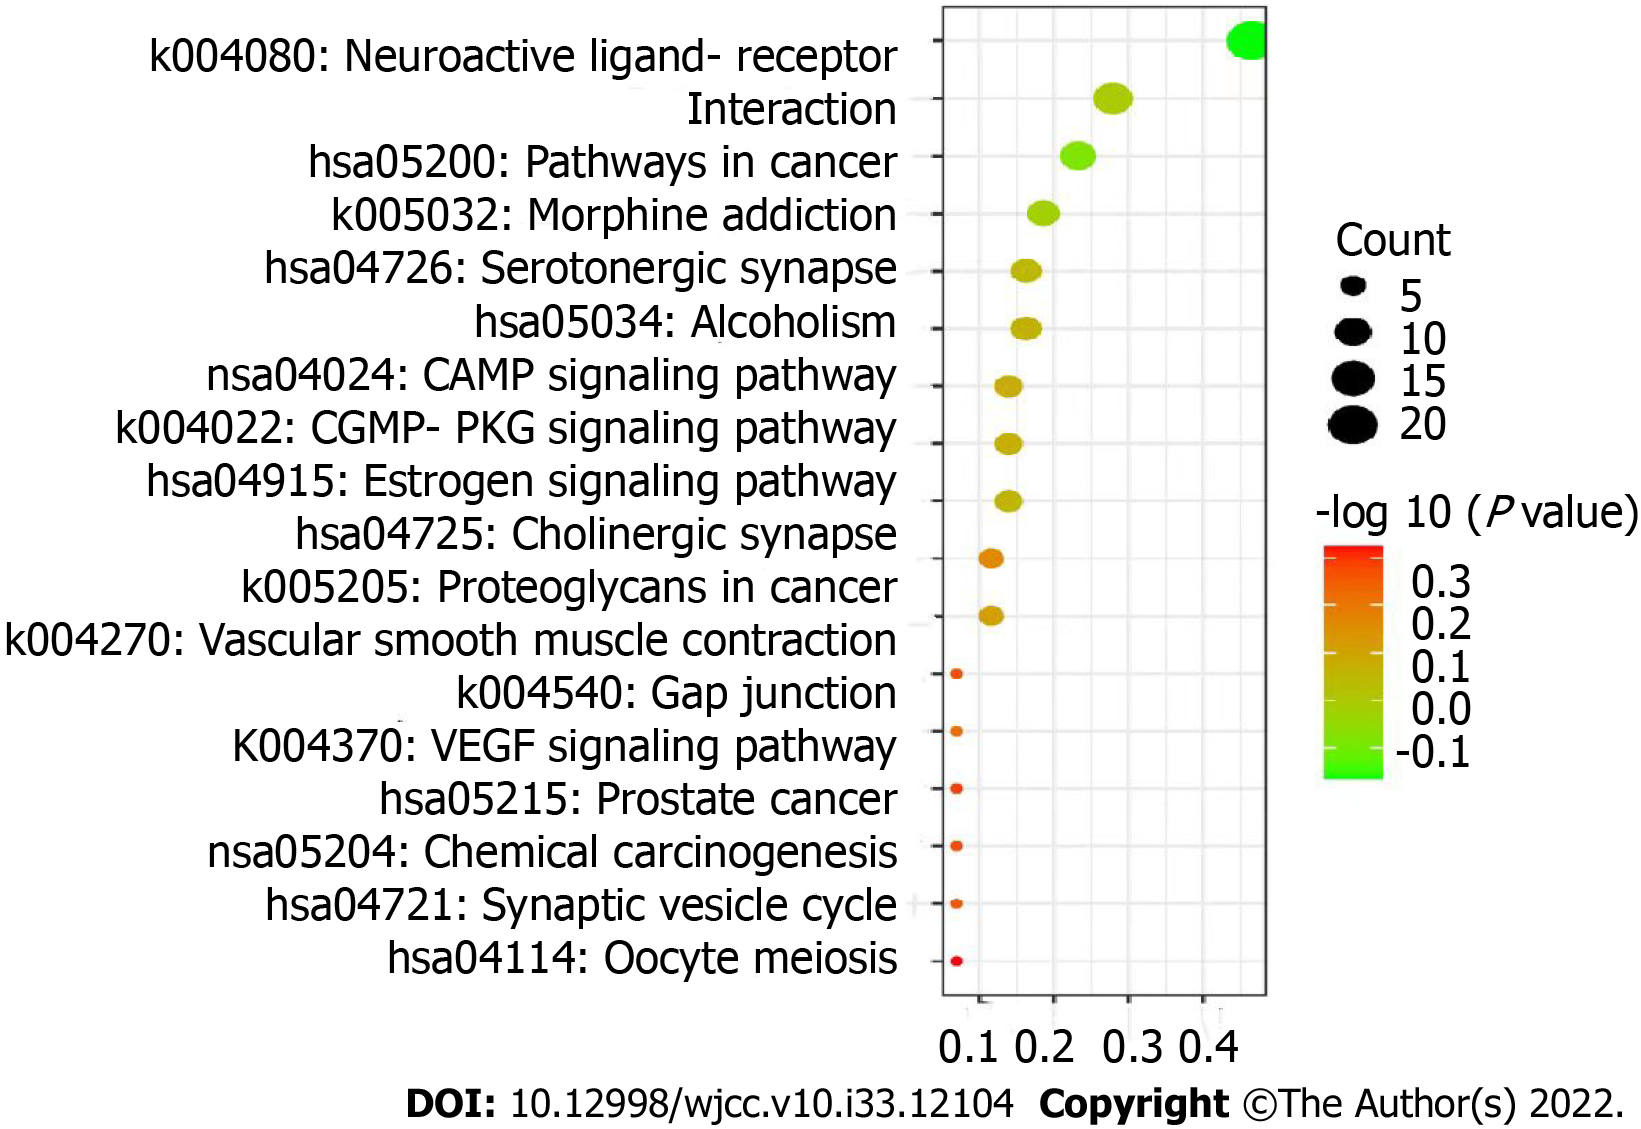
Figure 6 Kyoto Encyclopedia of Genes and Genomes pathway enrichment analysis.
In the bubble chart, the ordinate is the name of the biological process or pathway, the abscissa is the proportion of genes, the size of the bubble represents the number of genes enriched in each gene ontology, and the color represents the significance of the enrichment.
- Citation: Li ZH, Yang GH, Wang F. Molecular mechanisms of Baihedihuang decoction as a treatment for breast cancer related anxiety: A network pharmacology and molecular docking study. World J Clin Cases 2022; 10(33): 12104-12115
- URL: https://www.wjgnet.com/2307-8960/full/v10/i33/12104.htm
- DOI: https://dx.doi.org/10.12998/wjcc.v10.i33.12104


