Copyright
©The Author(s) 2022.
World J Clin Cases. Nov 26, 2022; 10(33): 12089-12103
Published online Nov 26, 2022. doi: 10.12998/wjcc.v10.i33.12089
Published online Nov 26, 2022. doi: 10.12998/wjcc.v10.i33.12089
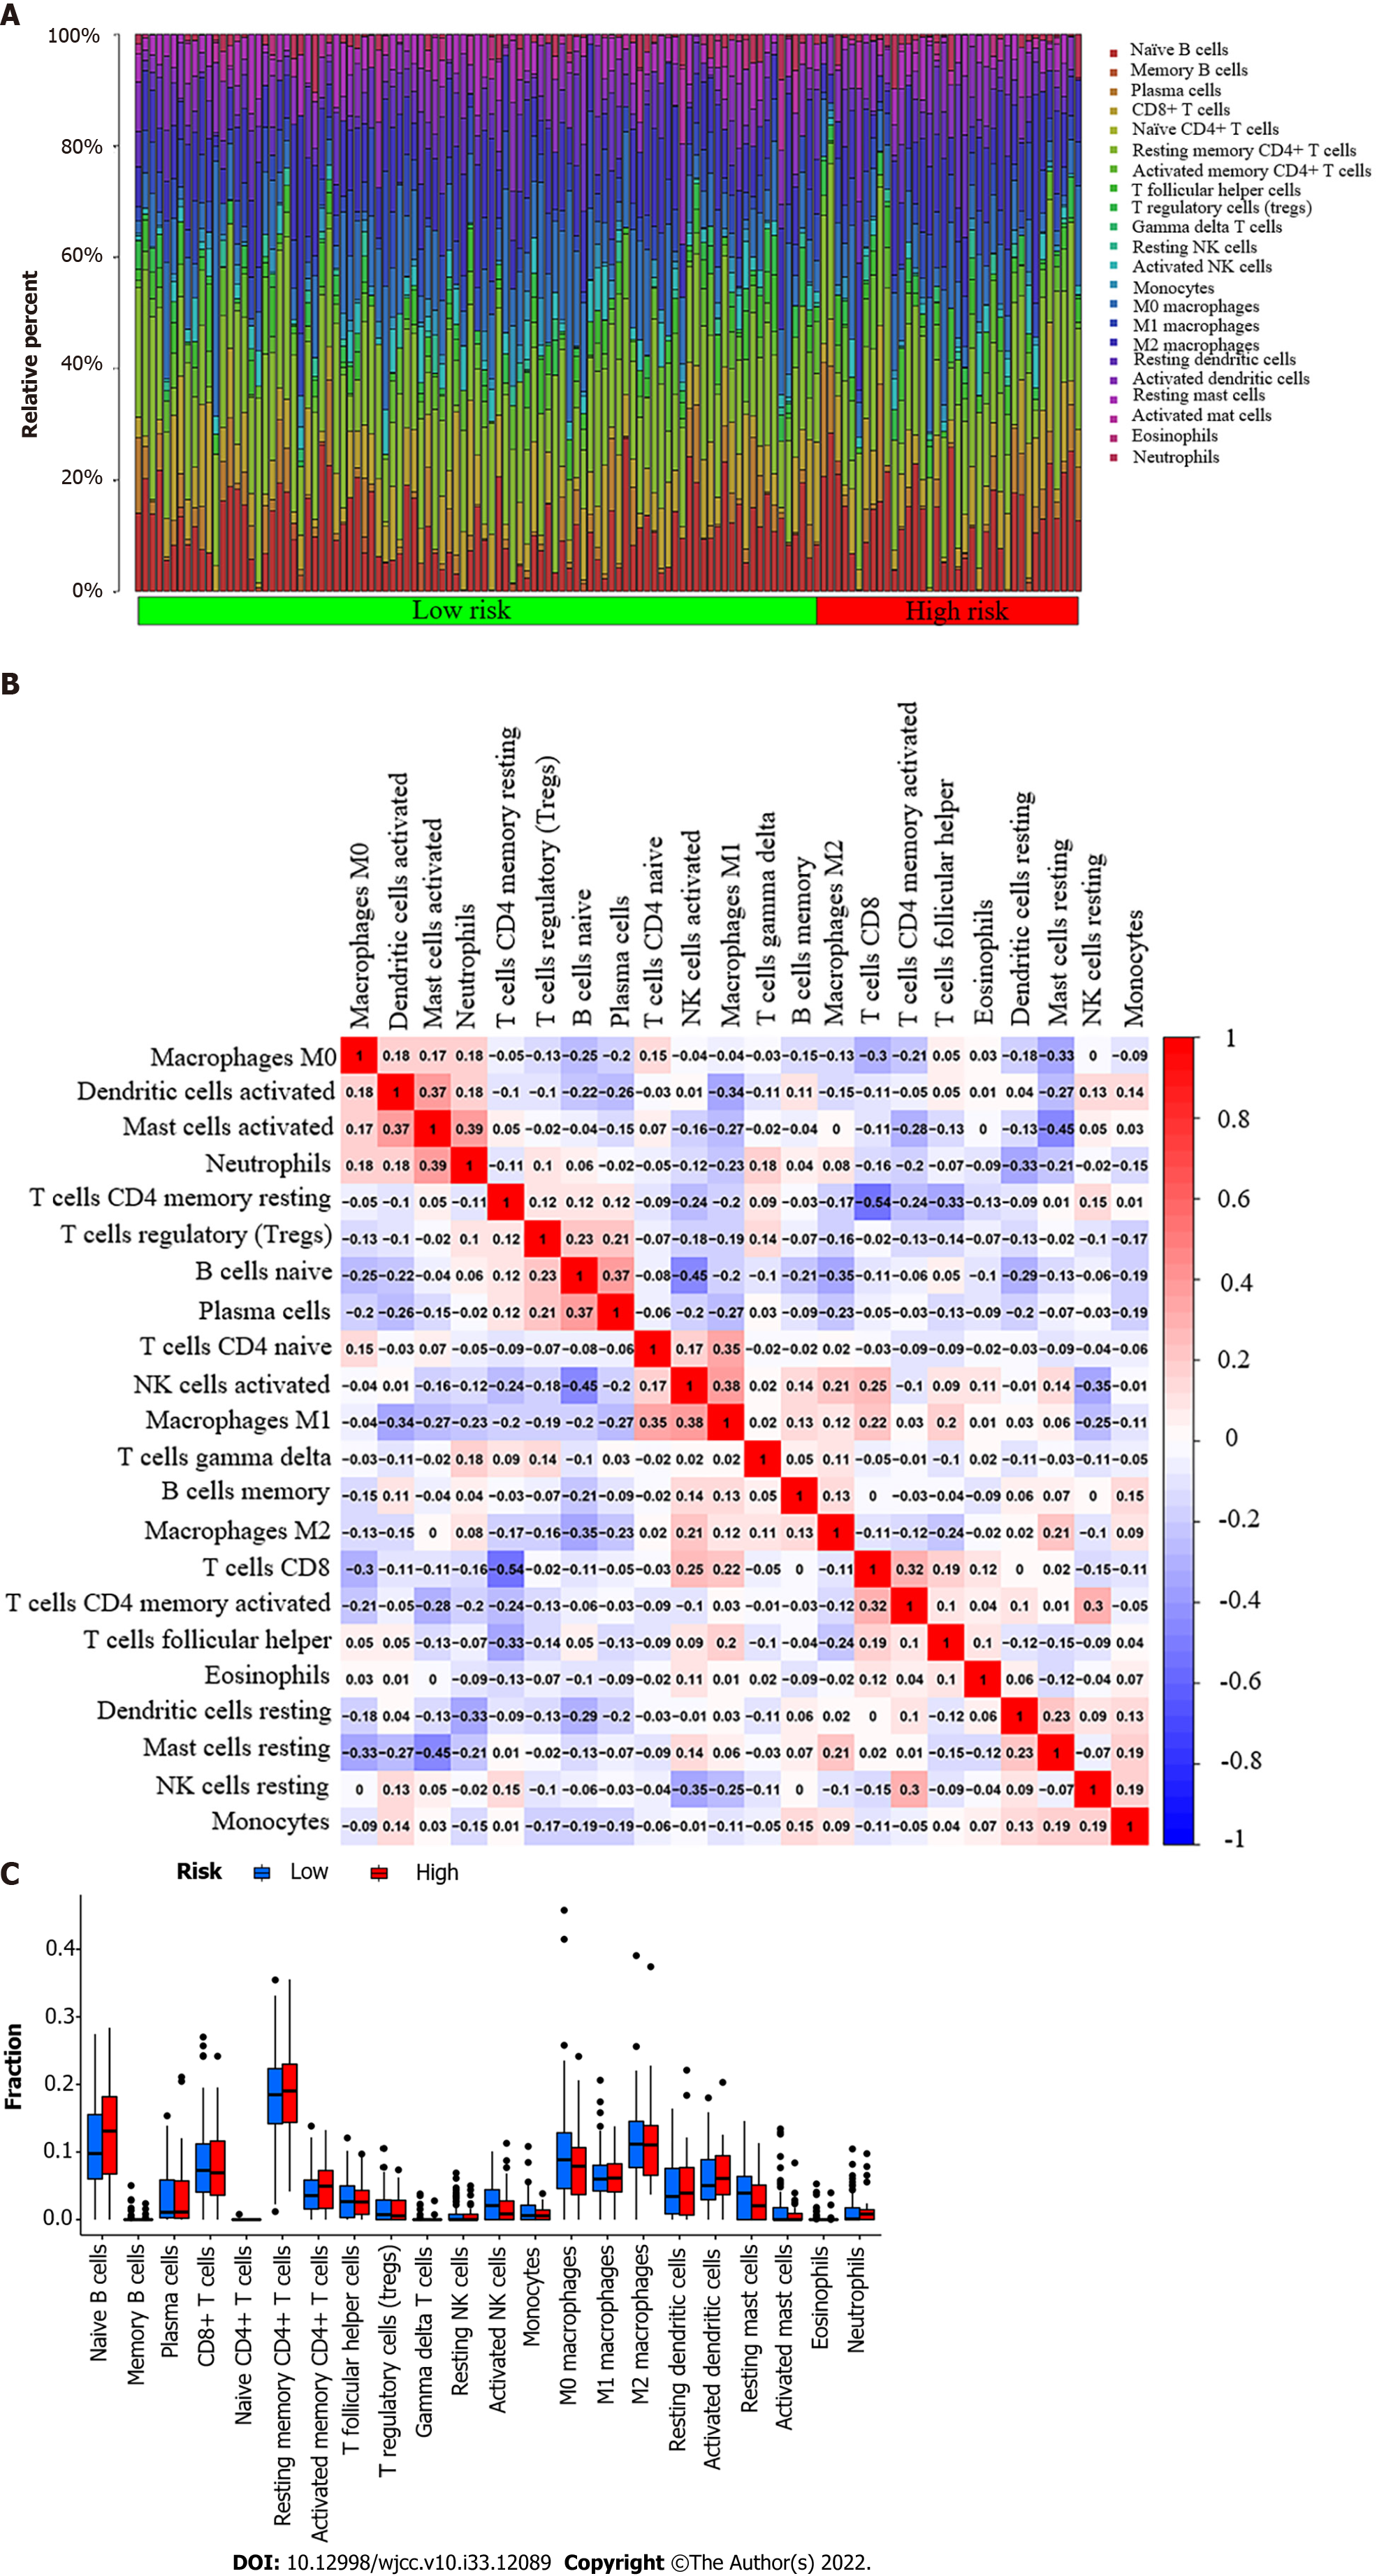
Figure 3 Tumor-infiltrating immune cell profile.
A: A barplot shows the ratio of 22 different tumor-infiltrating immune cells in esophageal cancer patients. Column names (X-axis): sample ID; B: A heatmap shows the association between 22 different types of tumor-infiltrating immune cells. Each dot represents the P value of the correlation between two different cell types, and Pearson’s correlation coefficient was used to determine significance; C: A bar graph shows the difference between esophageal cancer patients with high or low expression of pyruvate dehydrogenase A1 in terms of 22 different types of tumor-infiltrating immune cells. The Wilcoxon rank-sum test was used for the significance test.
- Citation: Xu H, Du QC, Wang XY, Zhou L, Wang J, Ma YY, Liu MY, Yu H. Comprehensive analysis of the relationship between cuproptosis-related genes and esophageal cancer prognosis. World J Clin Cases 2022; 10(33): 12089-12103
- URL: https://www.wjgnet.com/2307-8960/full/v10/i33/12089.htm
- DOI: https://dx.doi.org/10.12998/wjcc.v10.i33.12089


