Copyright
©The Author(s) 2022.
World J Clin Cases. Nov 16, 2022; 10(32): 11789-11803
Published online Nov 16, 2022. doi: 10.12998/wjcc.v10.i32.11789
Published online Nov 16, 2022. doi: 10.12998/wjcc.v10.i32.11789
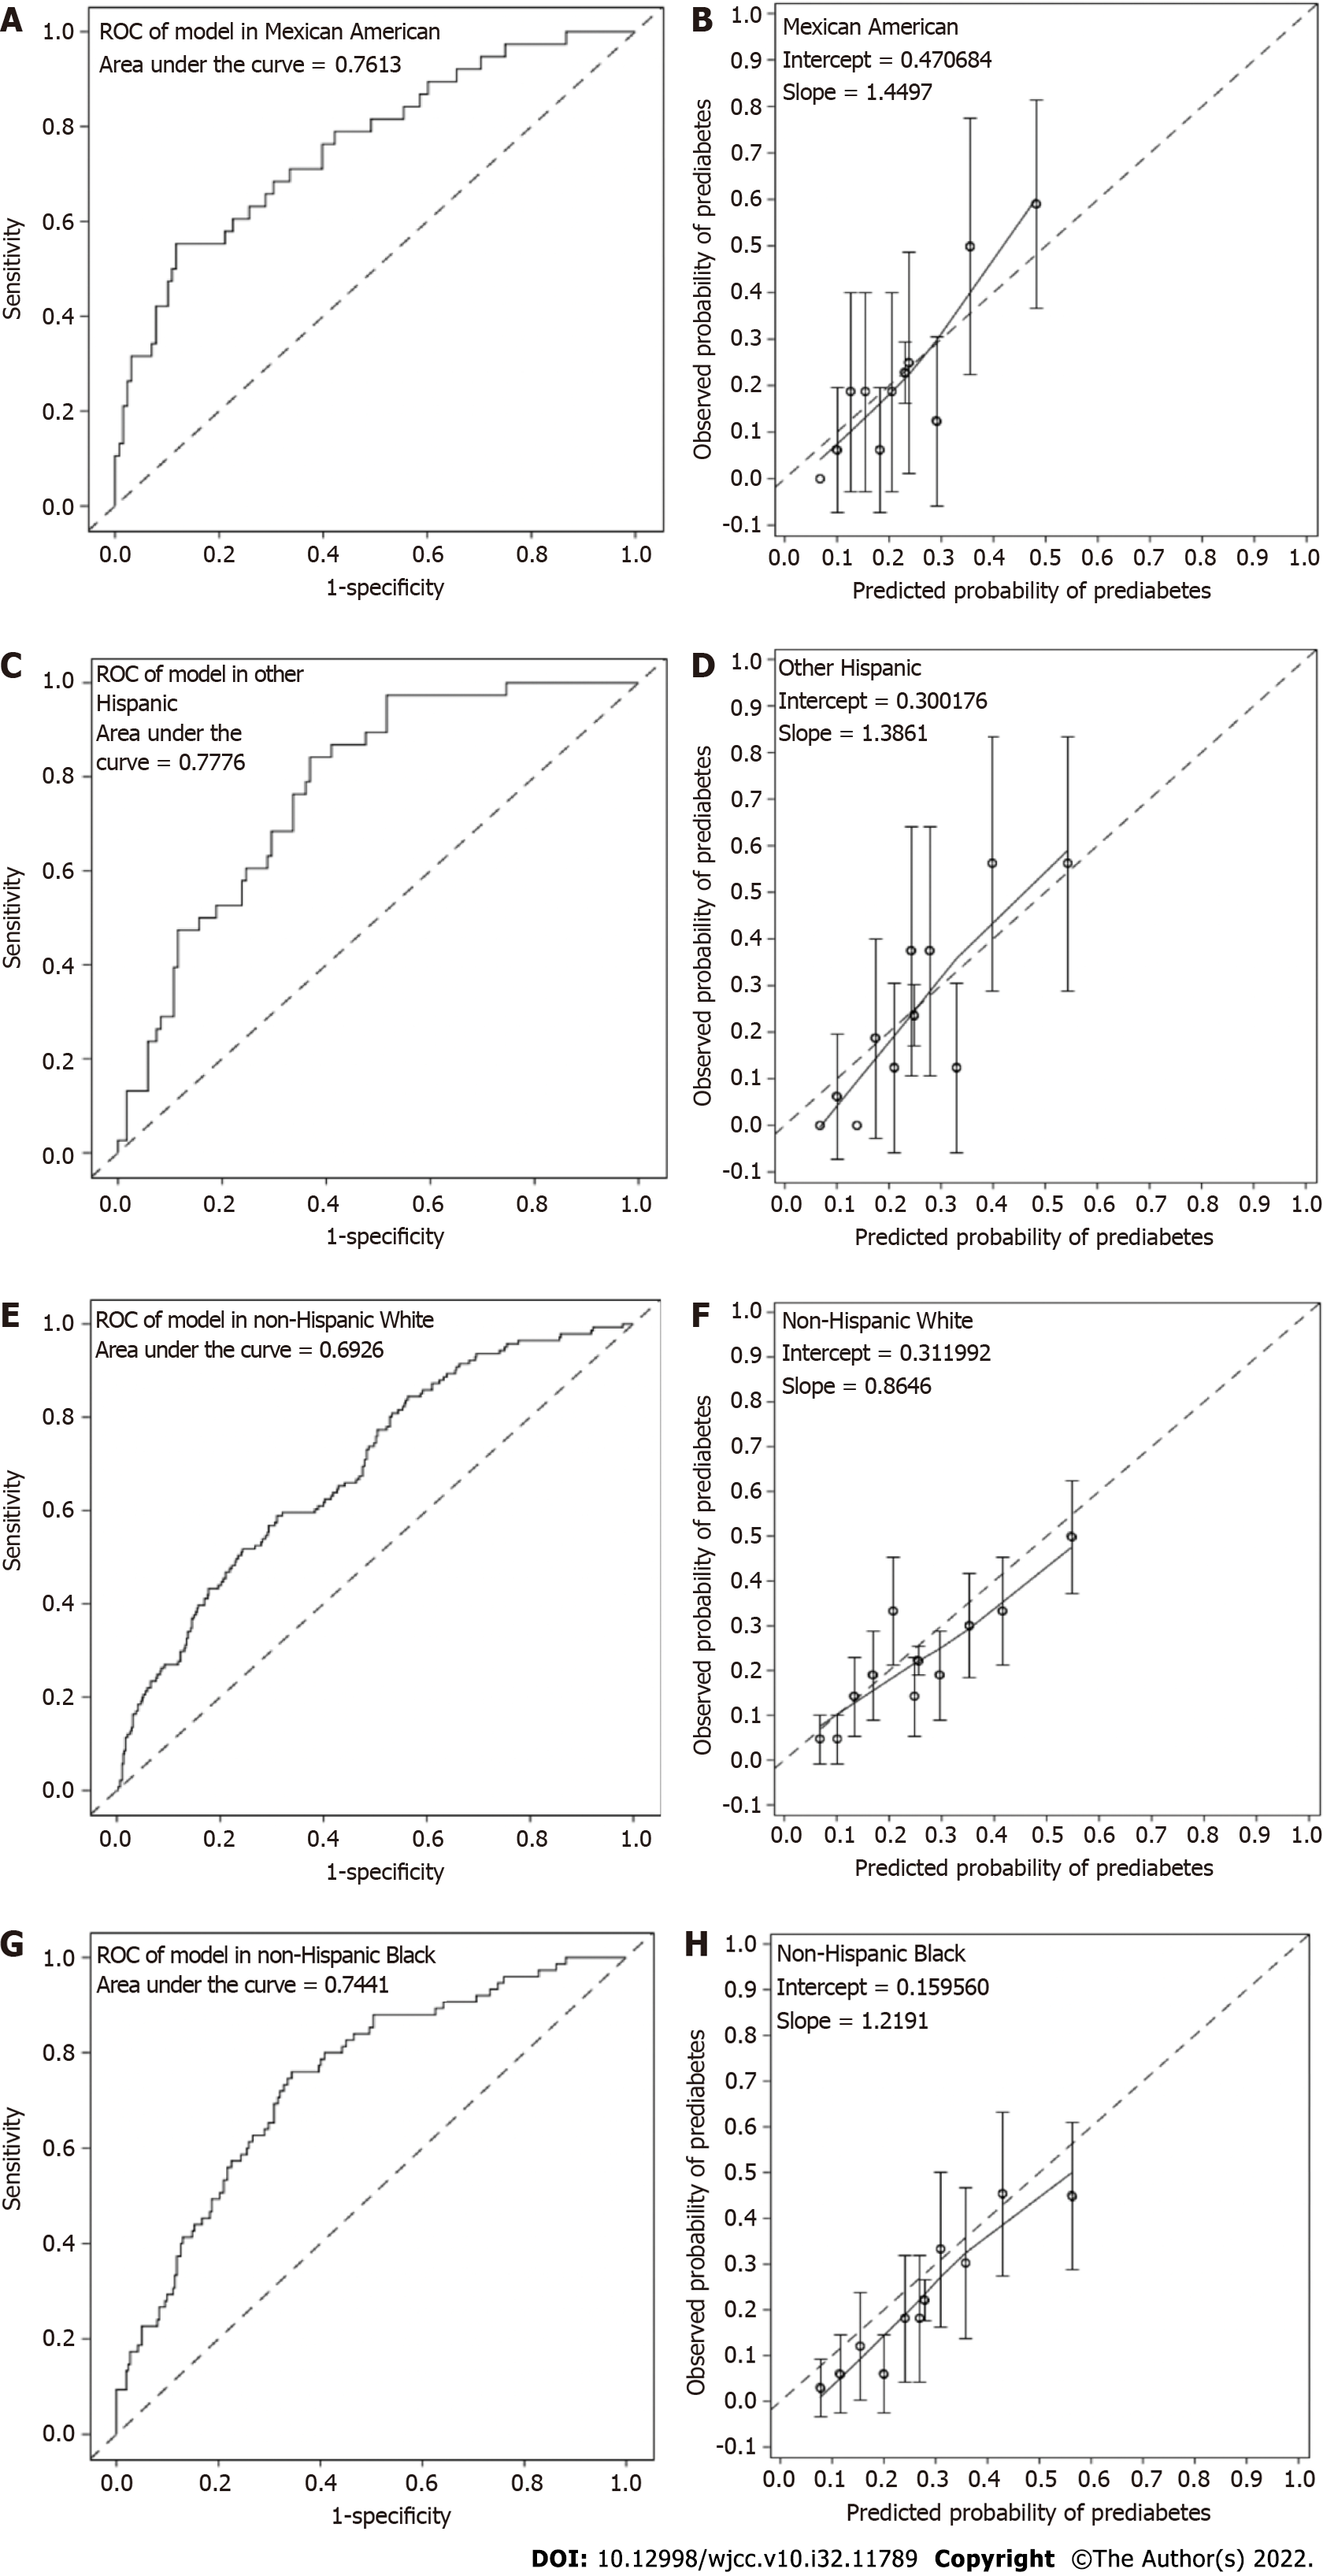
Figure 3 Discrimination and calibration of the prediabetes prediction model in external validation among diverse populations in National Health and Nutrition Examination Survey.
A: Area under the curve (AUC) of the model validated in Mexican American. The estimates (95% confidence interval) were 0.7613 (0.6725, 0.8502) in Mexican American; B: Calibration plot of the model in Mexican American. Hosmer-Leme show tests indicated good calibration of the model in Mexican American (P > 0.05); C: AUC of the model validated in other Hispanic. The estimates (95% confidence interval) were 0.7776 (0.7022, 0.8530) in other Hispanic; D: Calibration plot of the model in other Hispanic. Hosmer-Leme show tests indicated good calibration of the model in other Hispanic (P > 0.05); E: AUC of the model validated in non-Hispanic White. The estimates (95% confidence interval) were 0.6926 (0.6449, 0.7404) in non-Hispanic White; F: Calibration plot of the model in non-Hispanic White. Hosmer-Leme show tests indicated poor calibration in the White population with overestimated prediabetes risk (P = 0.016); G: AUC of the model validated in non-Hispanic Black. The estimates (95% confidence interval) were 0.7441 (0.6828, 0.8053) in non-Hispanic Black; H: Calibration plot of the model in non-Hispanic Black. Hosmer-Leme show tests indicated good calibration of the model in non-Hispanic Black (P > 0.05).
- Citation: Yu LP, Dong F, Li YZ, Yang WY, Wu SN, Shan ZY, Teng WP, Zhang B. Development and validation of a risk assessment model for prediabetes in China national diabetes survey. World J Clin Cases 2022; 10(32): 11789-11803
- URL: https://www.wjgnet.com/2307-8960/full/v10/i32/11789.htm
- DOI: https://dx.doi.org/10.12998/wjcc.v10.i32.11789


