Copyright
©The Author(s) 2022.
World J Clin Cases. Nov 16, 2022; 10(32): 11789-11803
Published online Nov 16, 2022. doi: 10.12998/wjcc.v10.i32.11789
Published online Nov 16, 2022. doi: 10.12998/wjcc.v10.i32.11789
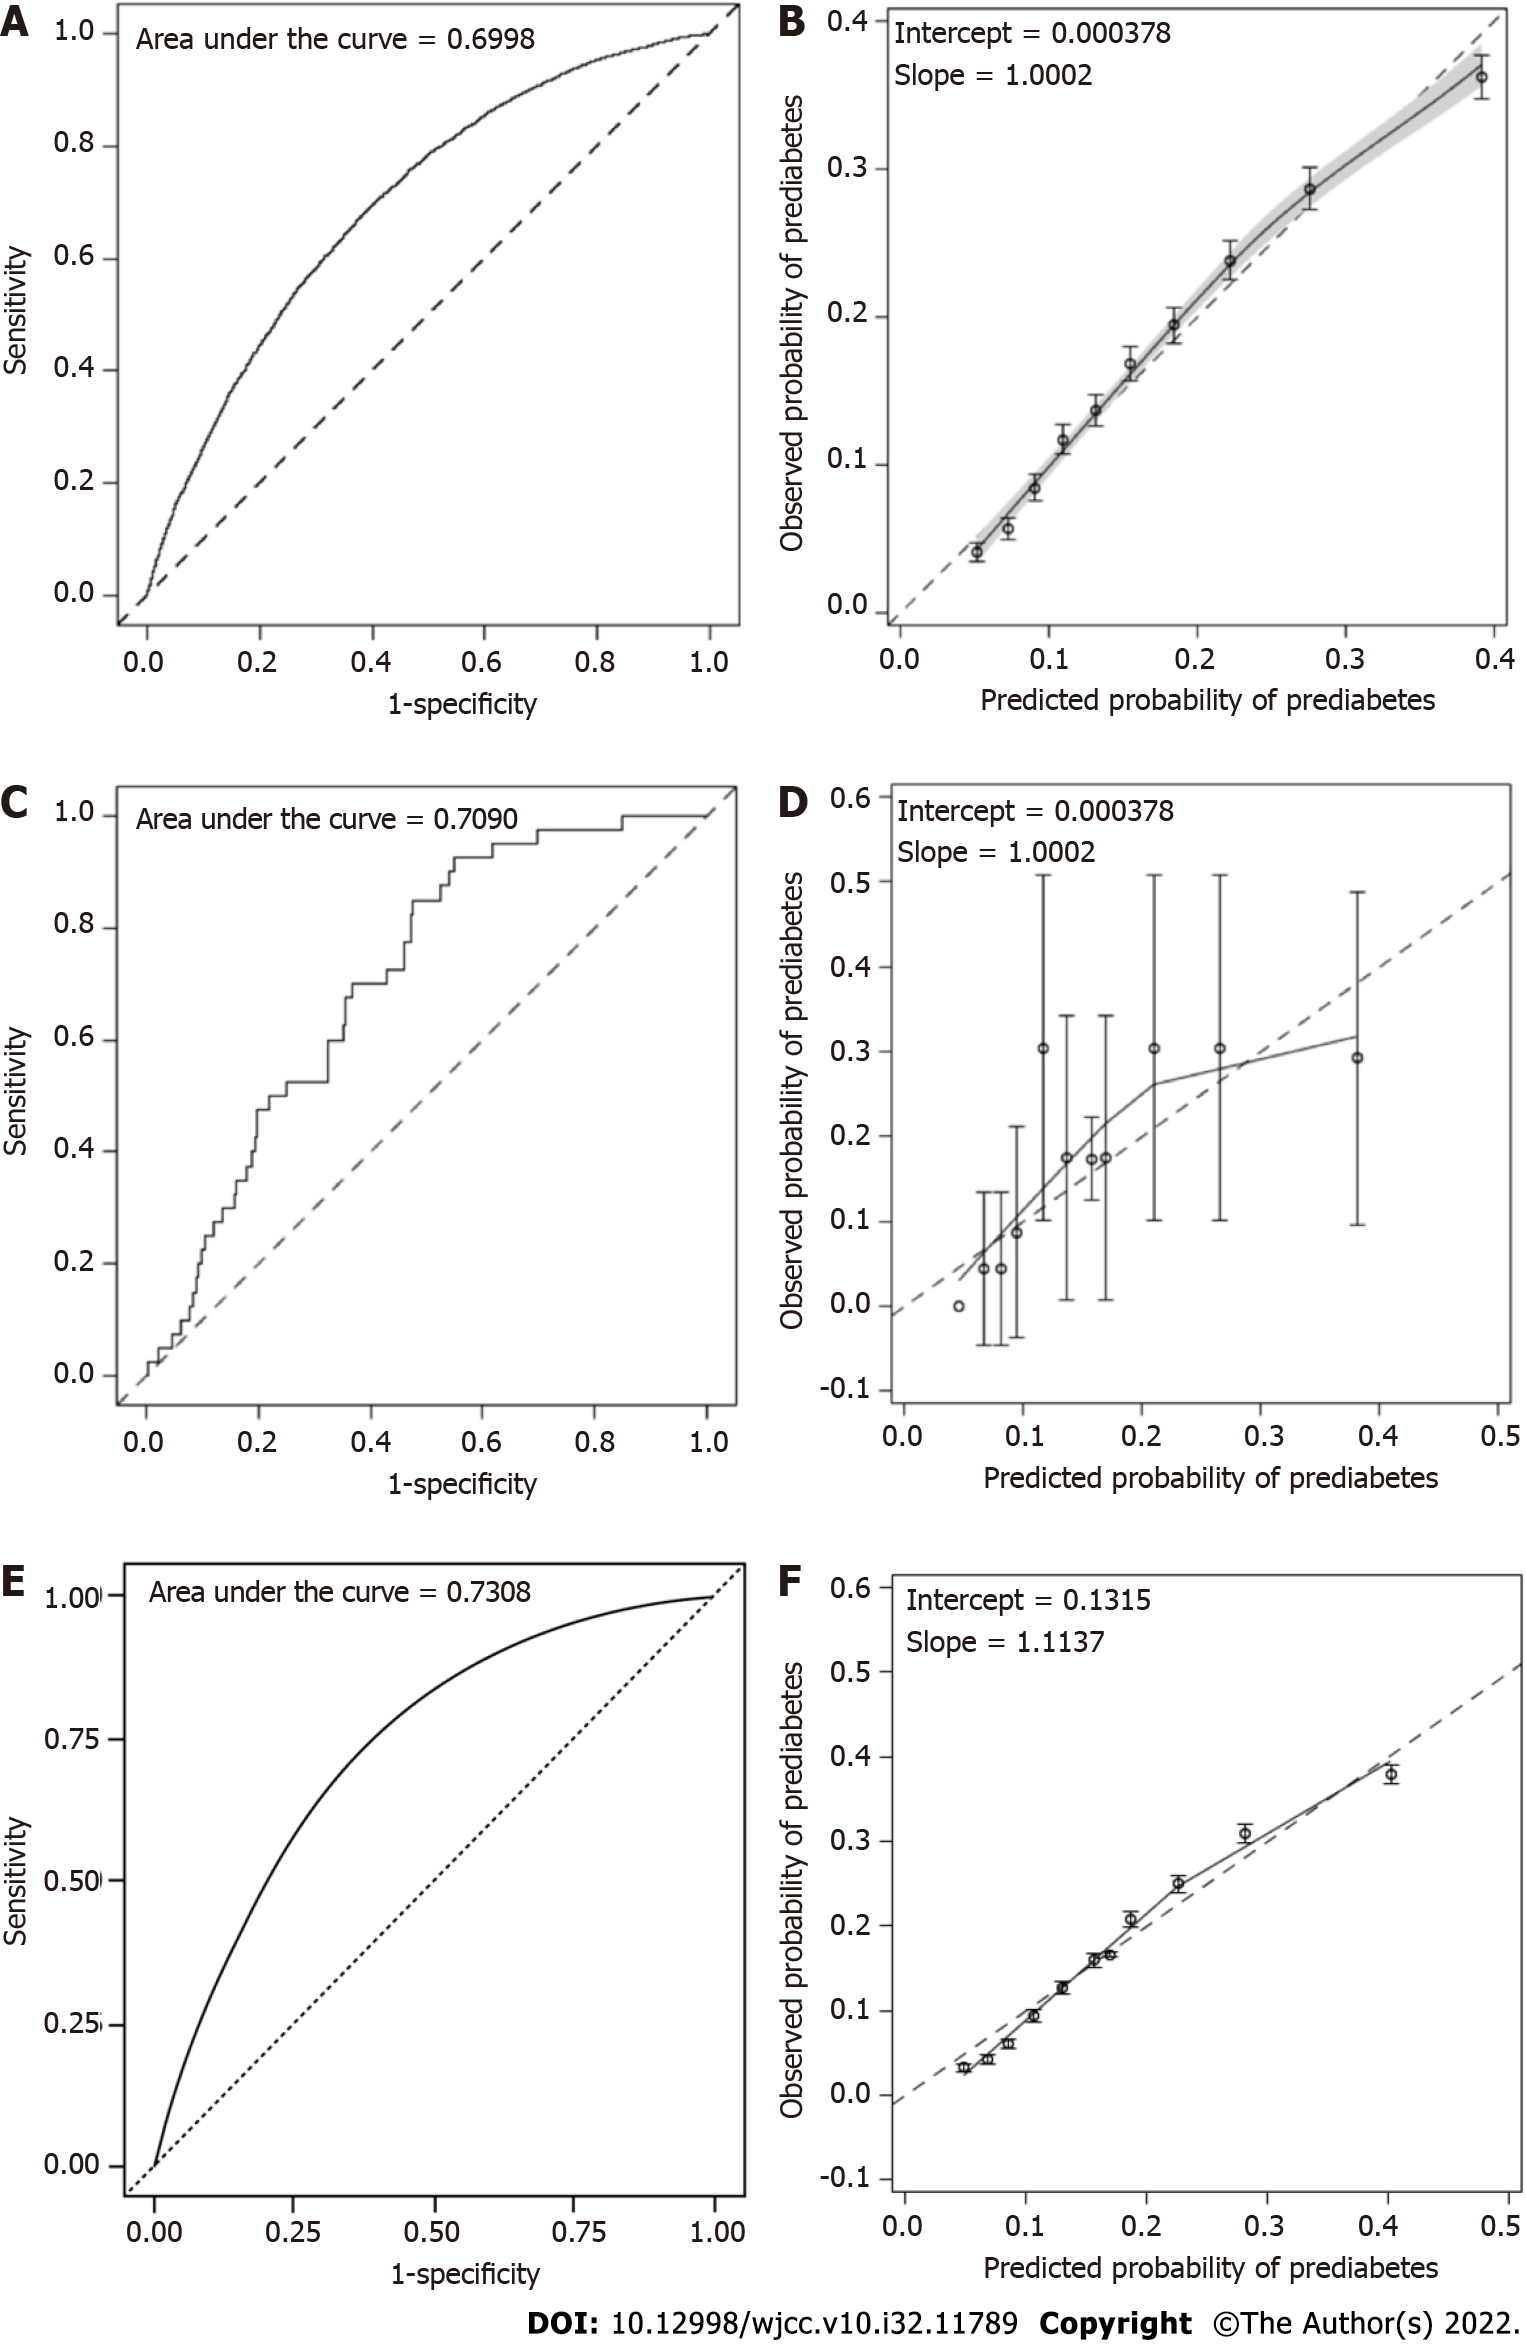
Figure 2 Discrimination and calibration of the prediabetes assessment model in the original population of the China National Diabetes and Metabolic Disorders Study, Asian population of the National Health and Nutrition Examination Survey and population of the Thyroid disorders, Iodine status and Diabetes Epidemiological survey study.
A: Area under the curve (AUC) of the original assessment model in the original population of the China National Diabetes and Metabolic Disorders Study (CNDMDS): The assessment model demonstrated acceptable discrimination, with apparent C statistics of 0.6998 (0.6933, 0.7063) and optimism-corrected C statistics of 0.6992. After recalibration, the C statistics remained the same, and the estimate (95%CI) was 0.6999 (0.6933 to 0.7064); B: Calibration plot of the assessment model in the original population of the CNDMDS: the calibration slope was 1.0002, and the intercept was 0.000378; C: AUC of the prediabetes assessment model: The C statistic was 0.7090 (95%CI: 0.6324 to 0.7857) in the Asian population in National Health and Nutrition Examination Survey (NHANES); D: Calibration plot of the assessment model: The calibration slope was 0.9238, and the intercept was 0.000376 in the Asian population in the NHANES; E: AUC of the prediabetes assessment model: The C statistic was 0.7308 (95%CI: 0.7260 to 0.7357) in the population of the Thyroid disorders, Iodine status and Diabetes Epidemiological survey (TIDE) study; F: Calibration plot of the assessment model: the calibration slope was 1.1137, and the intercept was 0.1315 in the population of the TIDE study.
- Citation: Yu LP, Dong F, Li YZ, Yang WY, Wu SN, Shan ZY, Teng WP, Zhang B. Development and validation of a risk assessment model for prediabetes in China national diabetes survey. World J Clin Cases 2022; 10(32): 11789-11803
- URL: https://www.wjgnet.com/2307-8960/full/v10/i32/11789.htm
- DOI: https://dx.doi.org/10.12998/wjcc.v10.i32.11789


