Copyright
©The Author(s) 2022.
World J Clin Cases. Nov 16, 2022; 10(32): 11743-11752
Published online Nov 16, 2022. doi: 10.12998/wjcc.v10.i32.11743
Published online Nov 16, 2022. doi: 10.12998/wjcc.v10.i32.11743
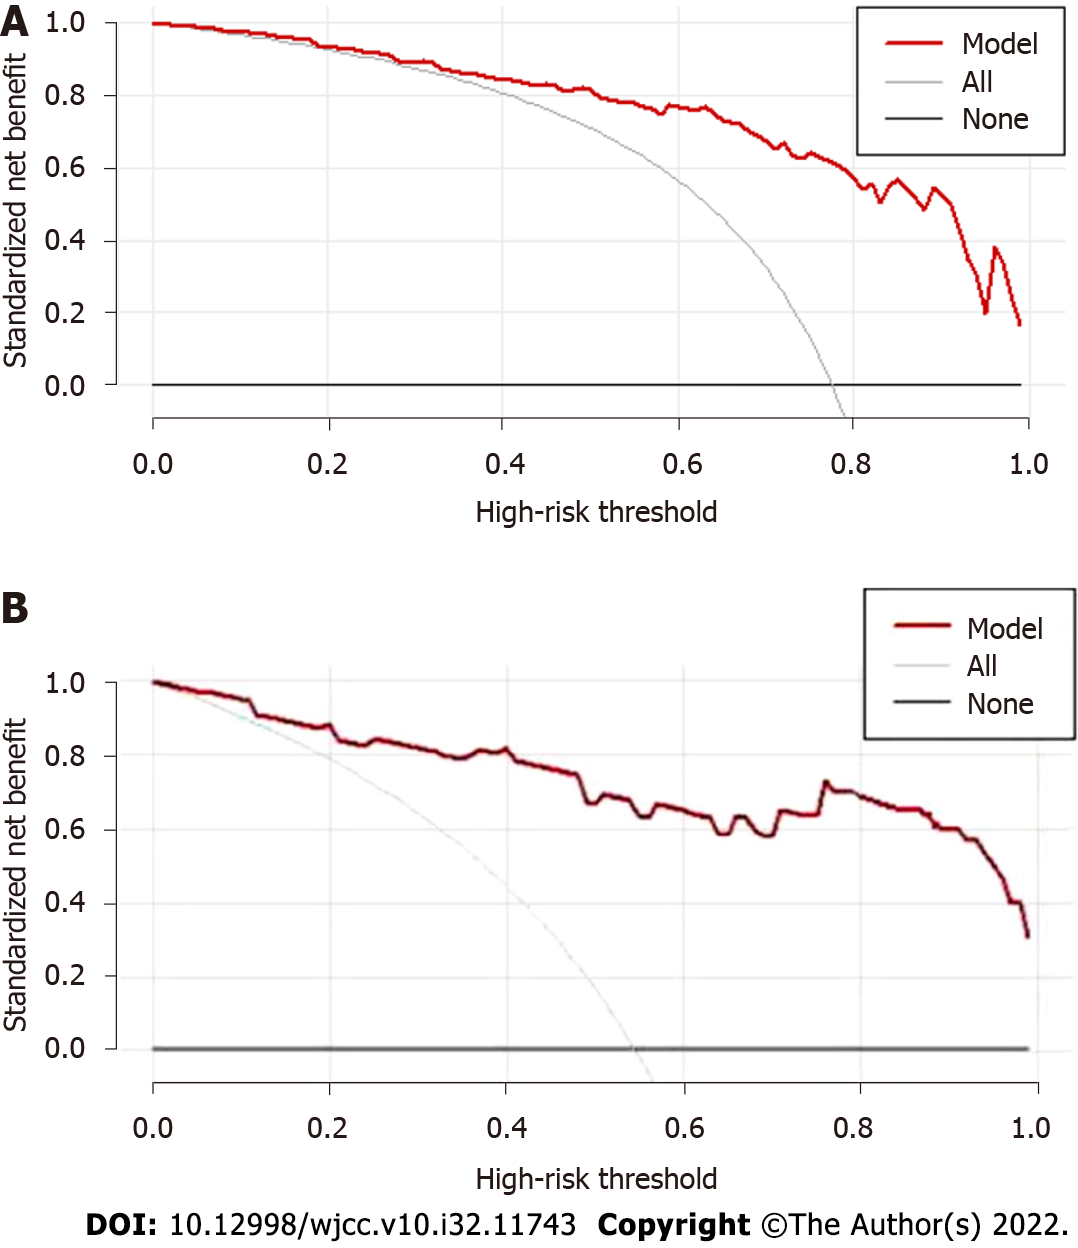
Figure 3 Decision curve analysis curve of prediction model.
The black line showed that in an extreme case, none of the crowd had EVs, sNT = 0; The grey line showed that in another extreme case, all of the crowd had EVs, the slop of sNT was negative; A: Decision curve analysis (DCA) curve of modeling group; B: DCA curve of external validation group.
- Citation: Yang LB, Zhao G, Tantai XX, Xiao CL, Qin SW, Dong L, Chang DY, Jia Y, Li H. Non-invasive model for predicting esophageal varices based on liver and spleen volume. World J Clin Cases 2022; 10(32): 11743-11752
- URL: https://www.wjgnet.com/2307-8960/full/v10/i32/11743.htm
- DOI: https://dx.doi.org/10.12998/wjcc.v10.i32.11743


