Copyright
©The Author(s) 2022.
World J Clin Cases. Nov 6, 2022; 10(31): 11638-11645
Published online Nov 6, 2022. doi: 10.12998/wjcc.v10.i31.11638
Published online Nov 6, 2022. doi: 10.12998/wjcc.v10.i31.11638
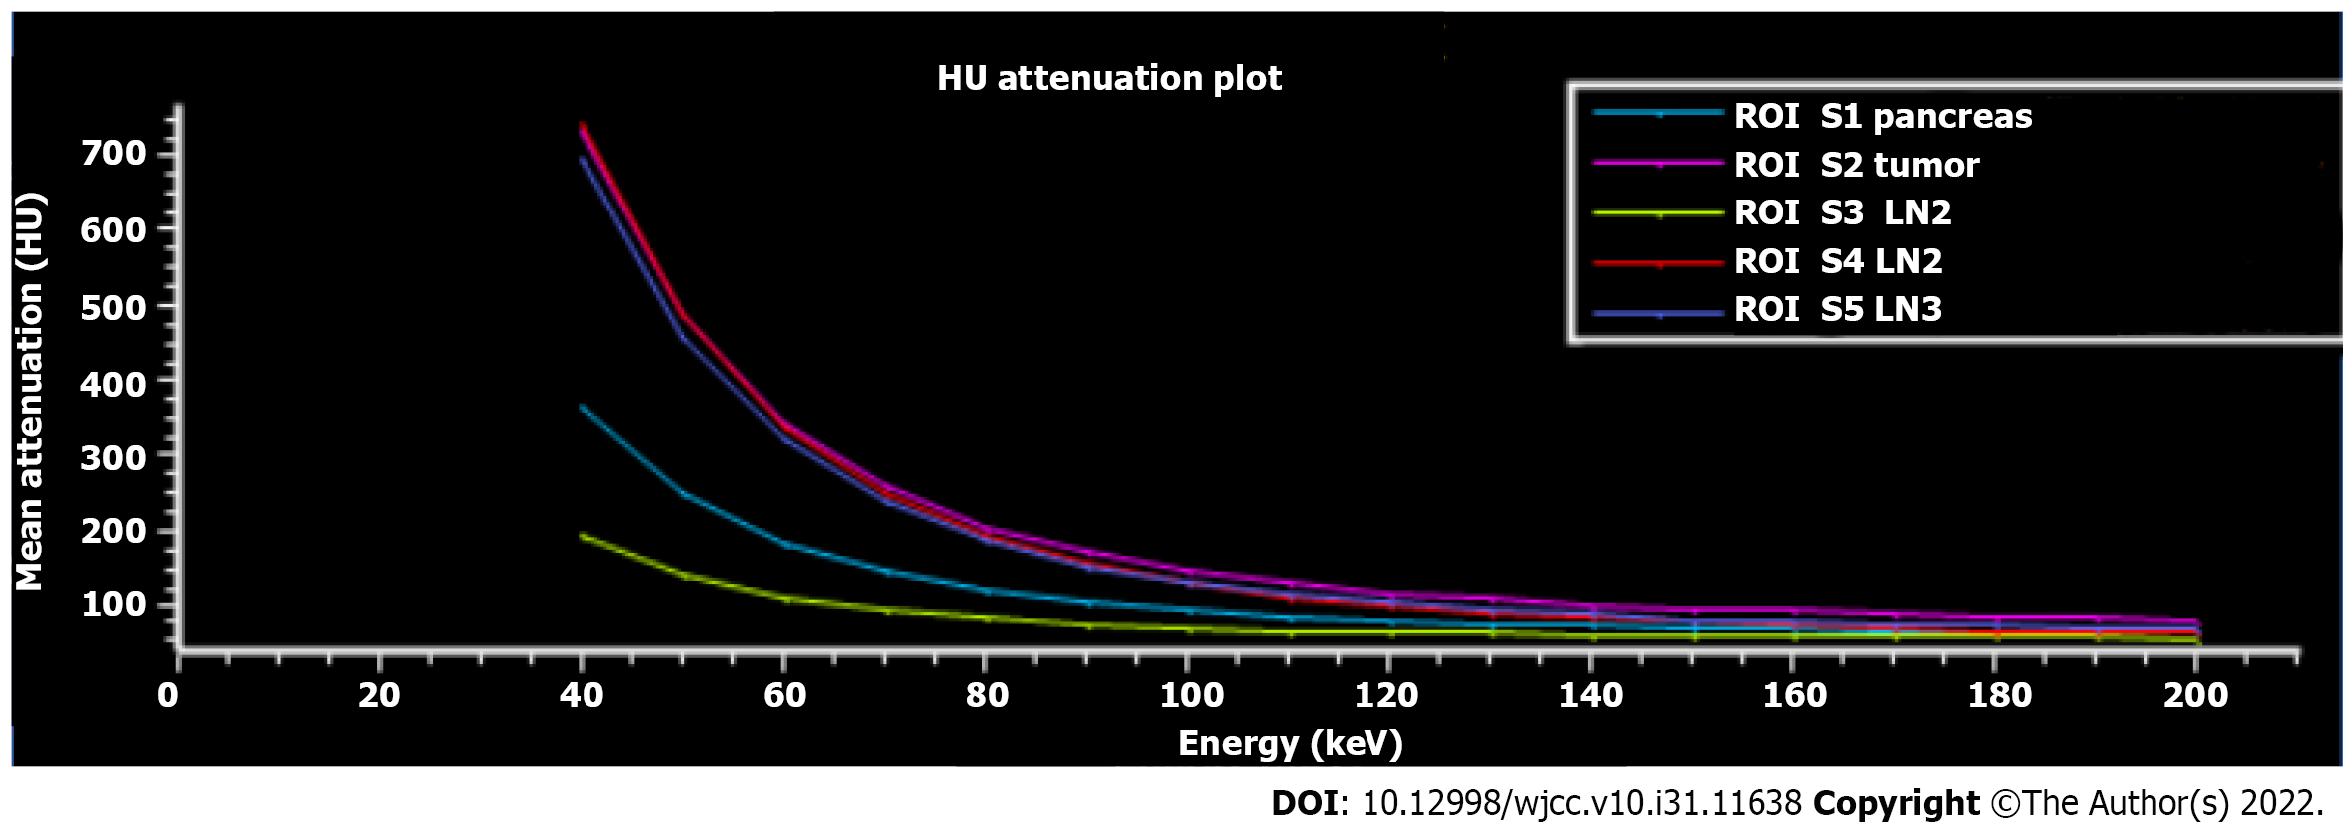
Figure 4 Region of interest plot of Hounsfield unit attenuation.
The Hounsfield unit attenuation plots of the tumor (purple) and lymph nodes 2 (red) and 3 (blue) have similar slopes, suggesting that the lymph nodes 2 and 3 were most likely metastatic lymph nodes (confirmed by pathological examination). LN: Lymph node; HU: Hounsfield unit.
- Citation: Li T, Yi RQ, Xie G, Wang DN, Ren YT, Li K. Pancreatic paraganglioma with multiple lymph node metastases found by spectral computed tomography: A case report and review of the literature. World J Clin Cases 2022; 10(31): 11638-11645
- URL: https://www.wjgnet.com/2307-8960/full/v10/i31/11638.htm
- DOI: https://dx.doi.org/10.12998/wjcc.v10.i31.11638


