Copyright
©The Author(s) 2022.
World J Clin Cases. Nov 6, 2022; 10(31): 11638-11645
Published online Nov 6, 2022. doi: 10.12998/wjcc.v10.i31.11638
Published online Nov 6, 2022. doi: 10.12998/wjcc.v10.i31.11638
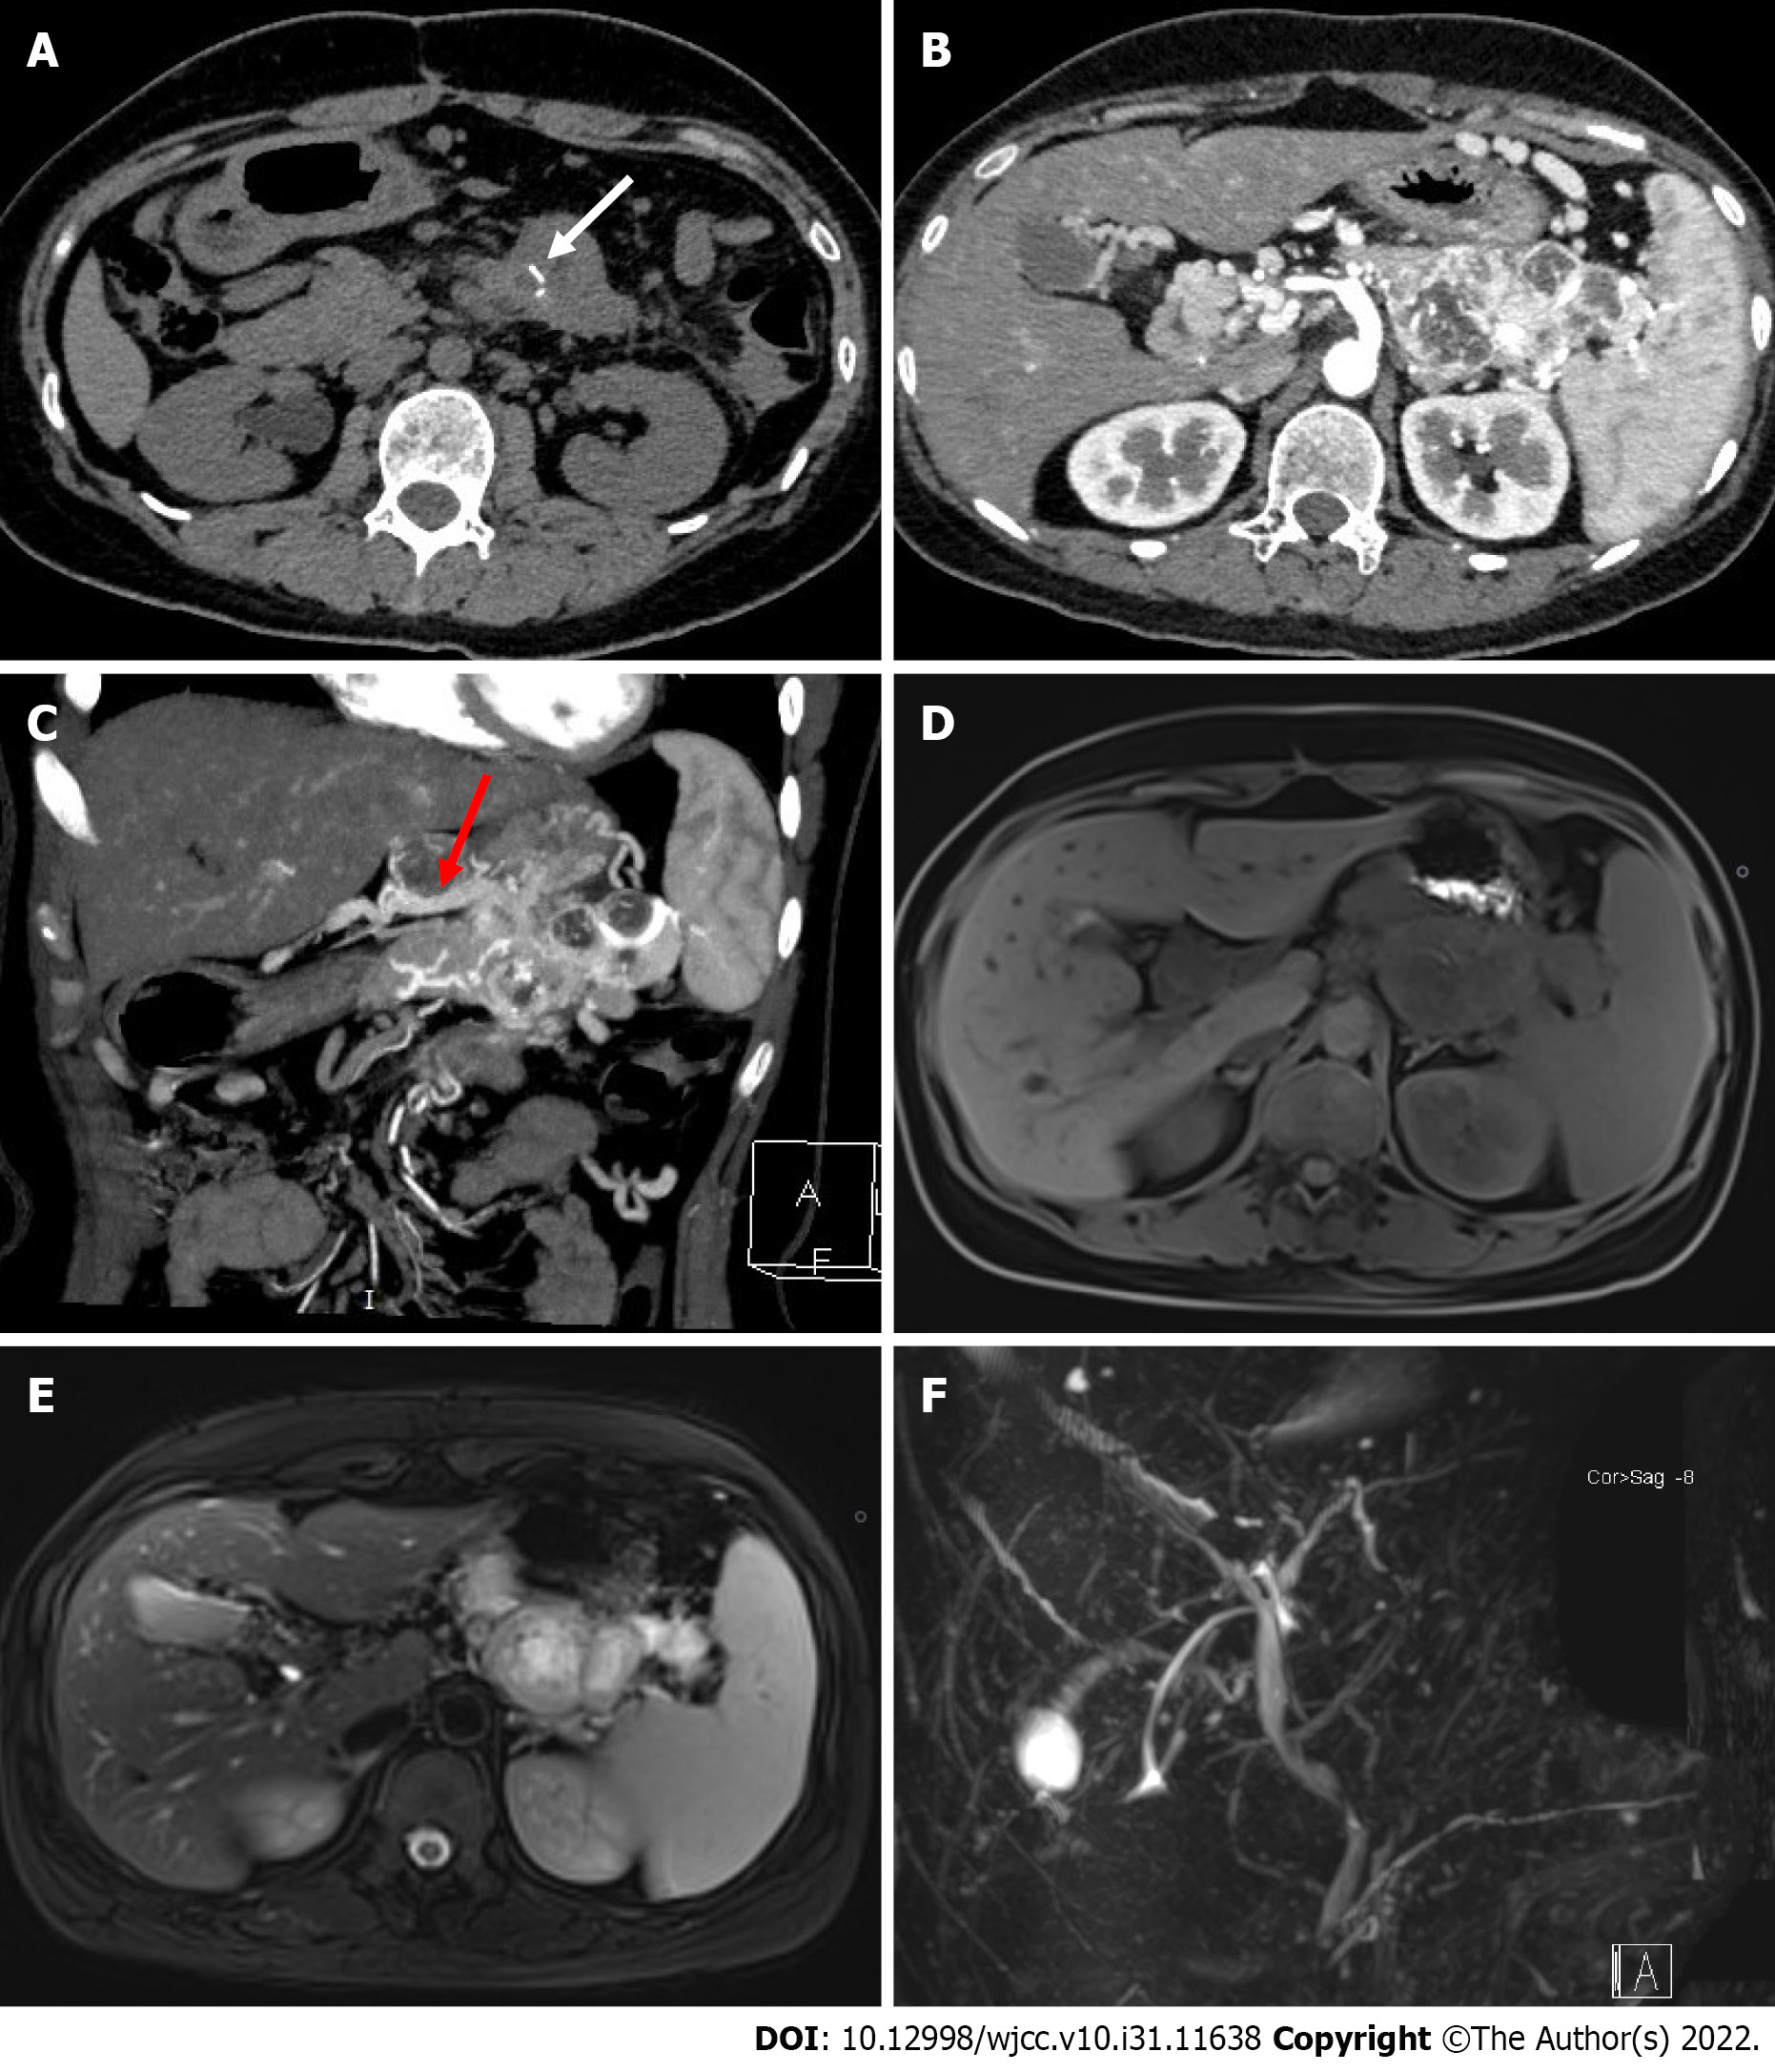
Figure 1 Images of the pancreatic tumor.
A: Non-contrast abdominal computed tomography (CT) image. White arrow indicates the strip calcification in the mass; B: Abdominal contrast-enhanced CT showed that the mass was significantly enhanced, and the abundant intratumoral vessels could be seen in the tumor; C: Maximum intensity projection (MIP) of the arterial phase in a coronal view. Red arrow indicates the draining vein into the portal vein; D-E: Abdominal MRI showed a low-intensity lesion on T1-weighted imaging (T1WI) and a hyper-intensity lesion on T2WI; F: MRCP shows no dilation of the bile duct and pancreatic duct.
- Citation: Li T, Yi RQ, Xie G, Wang DN, Ren YT, Li K. Pancreatic paraganglioma with multiple lymph node metastases found by spectral computed tomography: A case report and review of the literature. World J Clin Cases 2022; 10(31): 11638-11645
- URL: https://www.wjgnet.com/2307-8960/full/v10/i31/11638.htm
- DOI: https://dx.doi.org/10.12998/wjcc.v10.i31.11638


