Copyright
©The Author(s) 2022.
World J Clin Cases. Oct 26, 2022; 10(30): 11116-11121
Published online Oct 26, 2022. doi: 10.12998/wjcc.v10.i30.11116
Published online Oct 26, 2022. doi: 10.12998/wjcc.v10.i30.11116
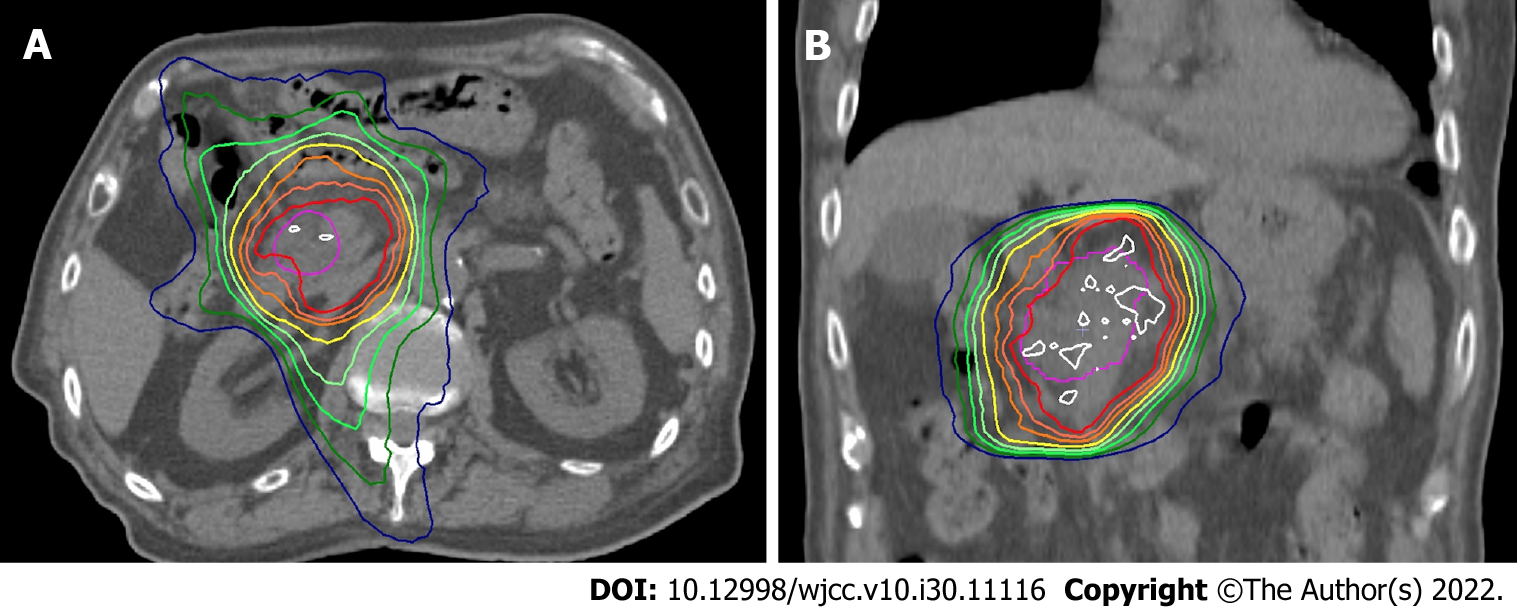
Figure 3 Computed tomography image with dose distribution of radiation therapy.
A: An axial image; B: A coronal image. White, red, inner-orange, outer-orange and yellow lines show 52.5 Gy, 50 Gy, 47.5 Gy, 45 Gy and 42.5 Gy, respectively.
- Citation: Harigai A, Kume K, Takahashi N, Omata S, Umezawa R, Jingu K, Masamune A. Favorable response after radiation therapy for intraductal papillary mucinous neoplasms manifesting as acute recurrent pancreatitis: A case report. World J Clin Cases 2022; 10(30): 11116-11121
- URL: https://www.wjgnet.com/2307-8960/full/v10/i30/11116.htm
- DOI: https://dx.doi.org/10.12998/wjcc.v10.i30.11116


