Copyright
©The Author(s) 2022.
World J Clin Cases. Oct 26, 2022; 10(30): 11010-11015
Published online Oct 26, 2022. doi: 10.12998/wjcc.v10.i30.11010
Published online Oct 26, 2022. doi: 10.12998/wjcc.v10.i30.11010
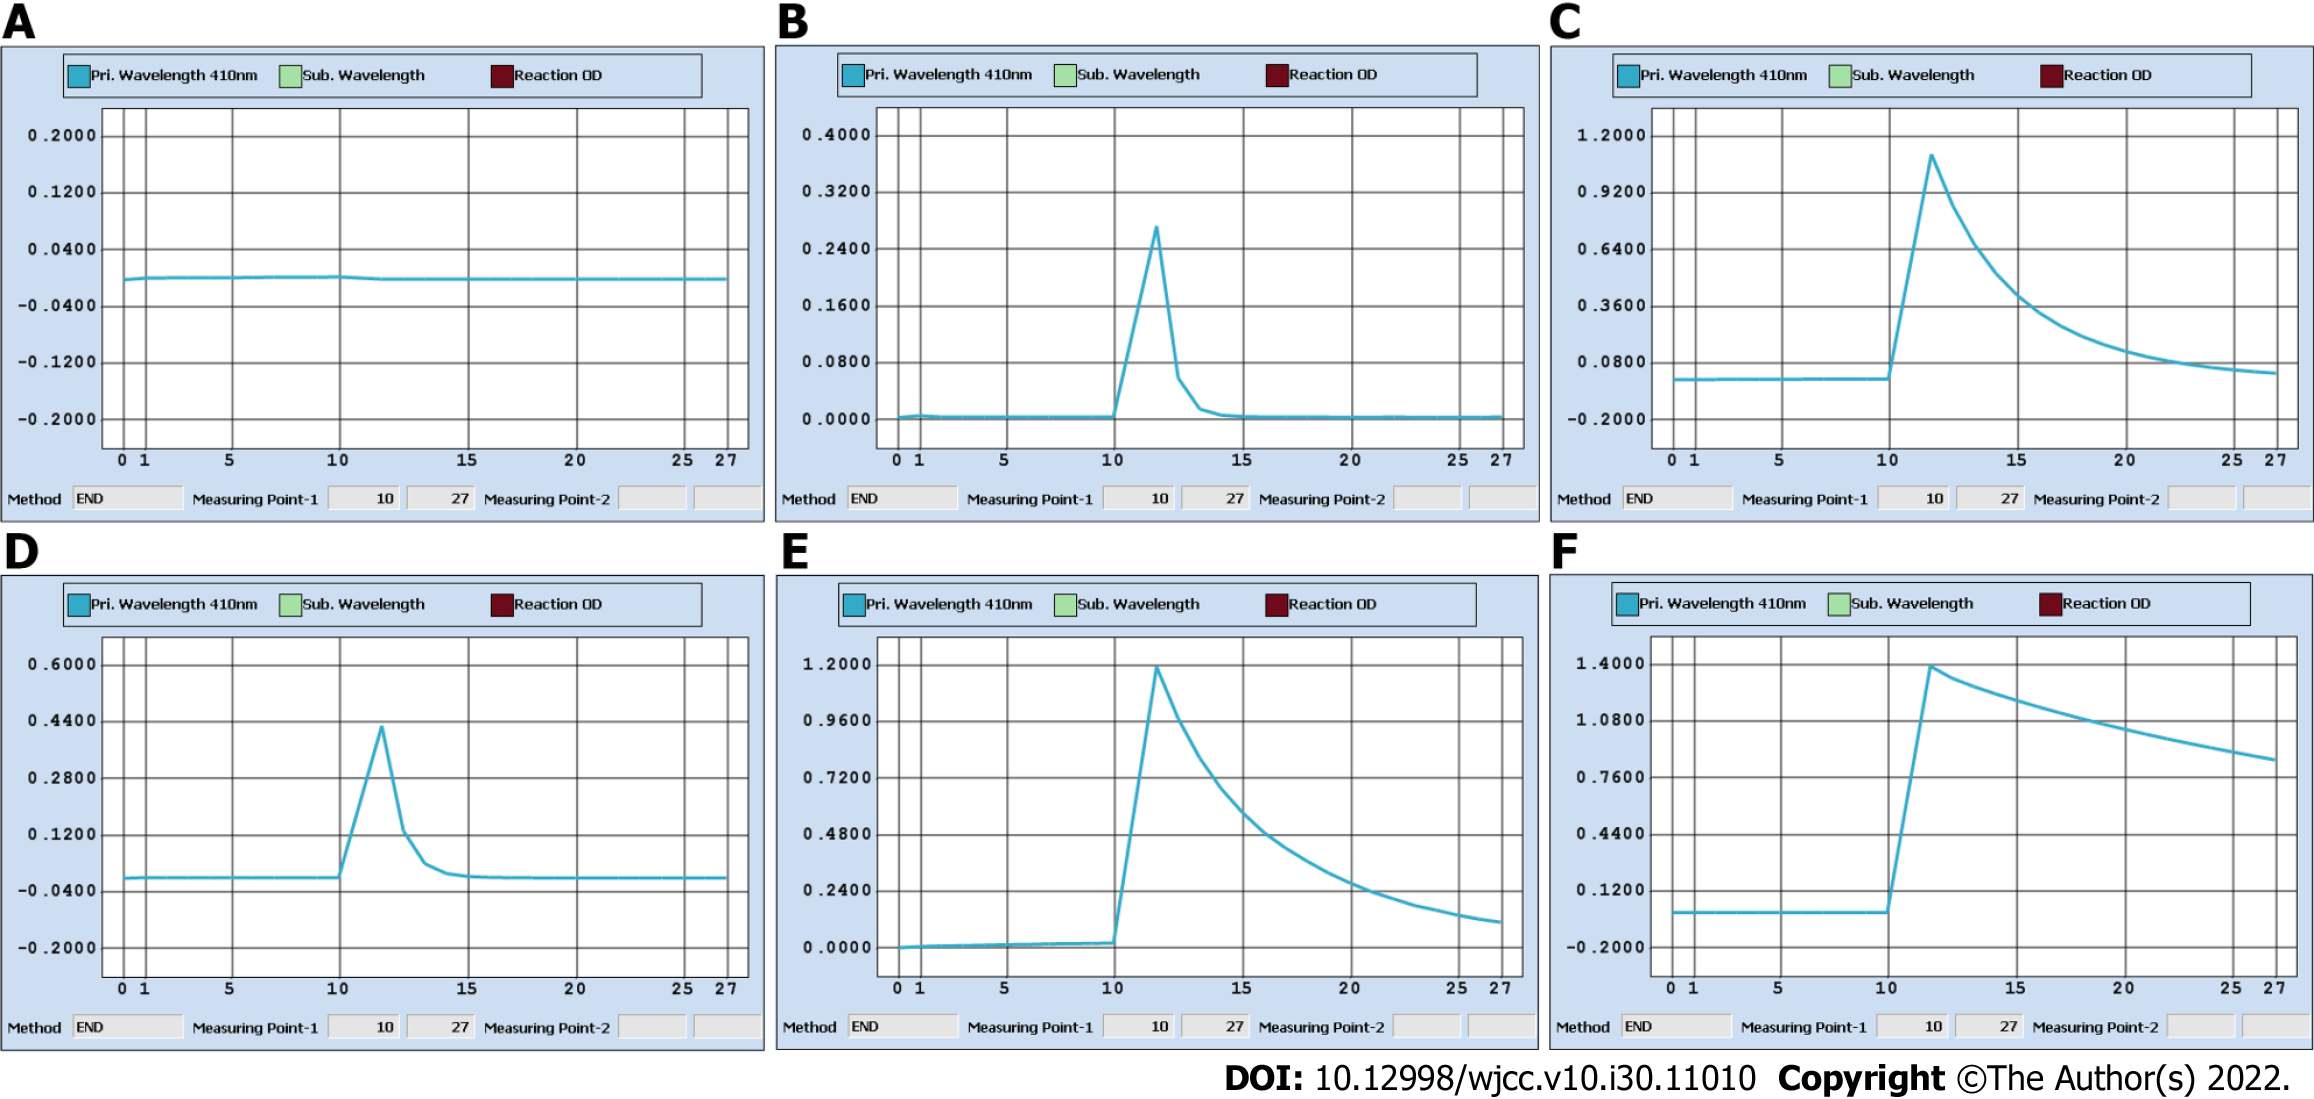
Figure 2 Ce4+ absorbance curves of two specimens during admission-discharge procedures to calculate the actual spot urine iodine concentrations.
A-C: Original random urine specimen on January 15 (preoperation) (A) and its 10- (B) and 100-fold (C) dilutions; D-F: Original random urine specimen on January 17 (1 d before discharge) (D) and its 10- (E) and 100-fold (F) dilutions.
- Citation: Zhang SC, Yan CJ, Li YF, Cui T, Shen MP, Zhang JX. Right time to detect urine iodine during papillary thyroid carcinoma diagnosis and treatment: A case report. World J Clin Cases 2022; 10(30): 11010-11015
- URL: https://www.wjgnet.com/2307-8960/full/v10/i30/11010.htm
- DOI: https://dx.doi.org/10.12998/wjcc.v10.i30.11010


