Copyright
©The Author(s) 2022.
World J Clin Cases. Oct 26, 2022; 10(30): 10984-10996
Published online Oct 26, 2022. doi: 10.12998/wjcc.v10.i30.10984
Published online Oct 26, 2022. doi: 10.12998/wjcc.v10.i30.10984
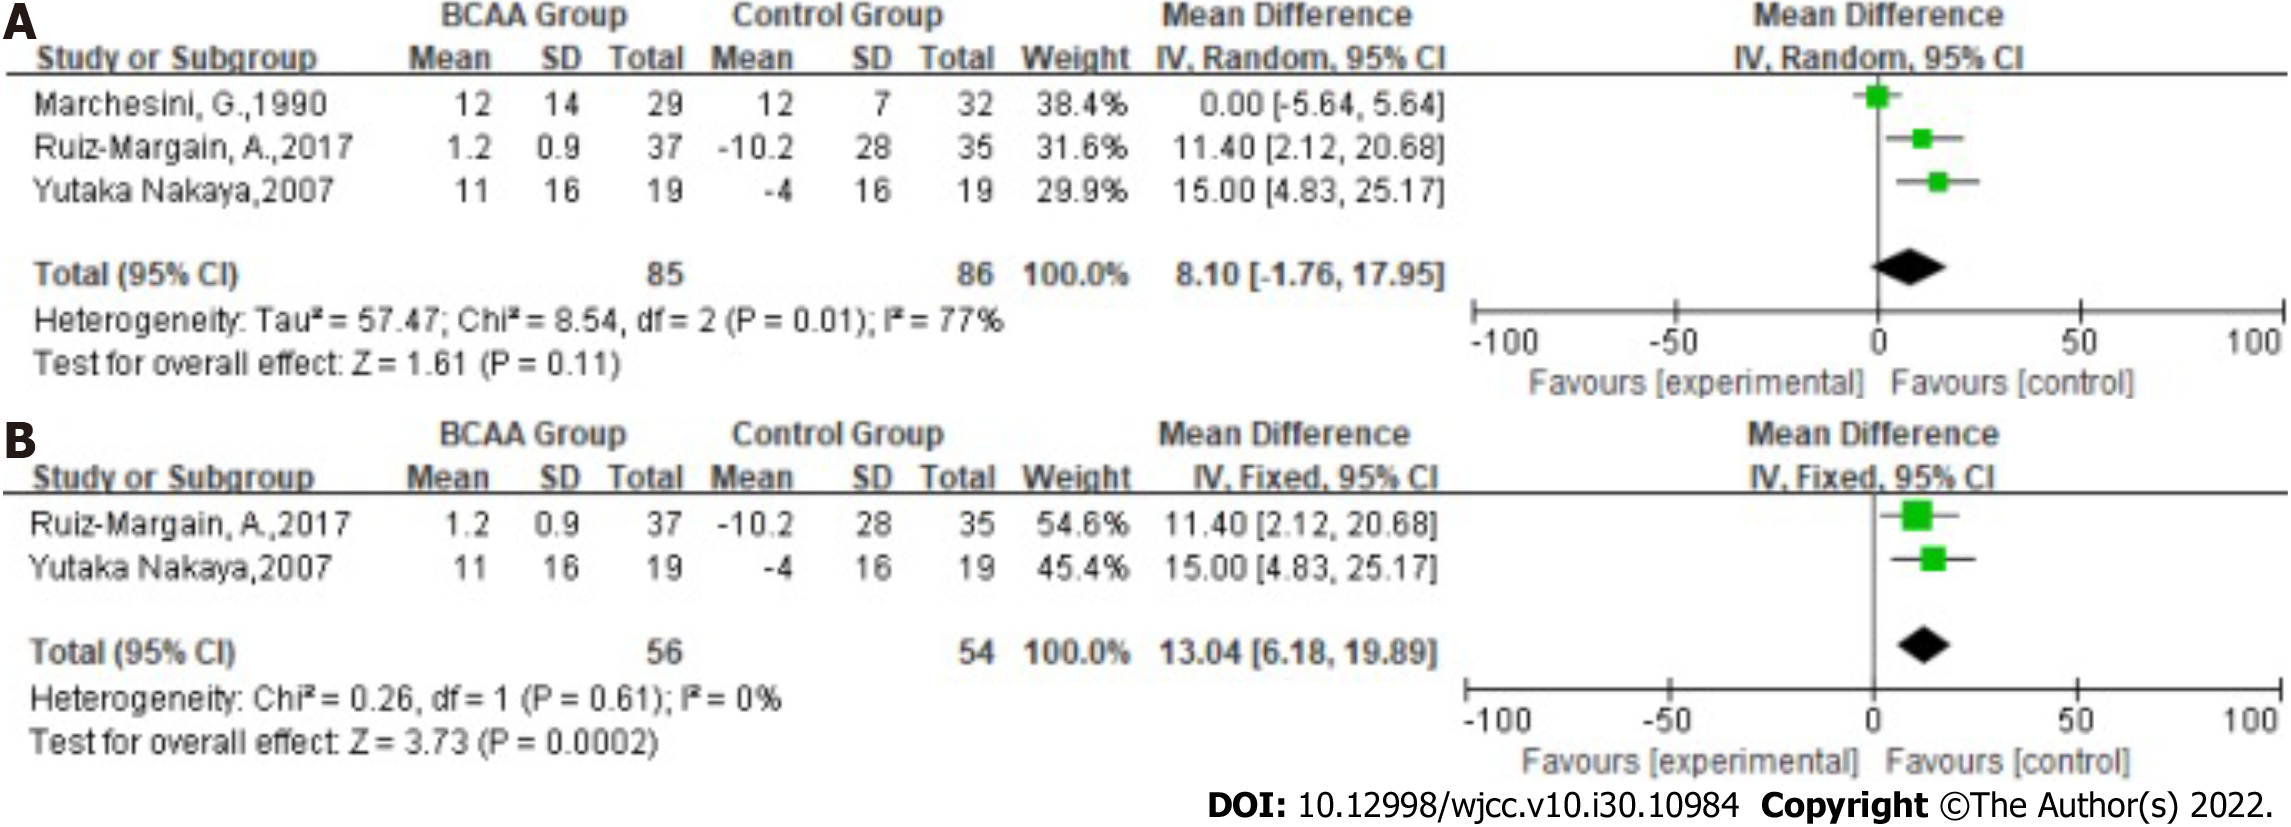
Figure 8 Forest plots.
A: Forest plots of the meta-analysis of the glucose level; B: Forest plots of subgroup analysis of the glucose level (the Child grade of the patients in the included studies was A or B). BCAA: Branched-chain amino acids; N: Number; CI: Confidence interval; SMD: Standard mean difference; I2: I-square.
- Citation: Du JY, Shu L, Zhou YT, Zhang L. Branched-chain amino acids supplementation has beneficial effects on the progression of liver cirrhosis: A meta-analysis. World J Clin Cases 2022; 10(30): 10984-10996
- URL: https://www.wjgnet.com/2307-8960/full/v10/i30/10984.htm
- DOI: https://dx.doi.org/10.12998/wjcc.v10.i30.10984


