Copyright
©The Author(s) 2022.
World J Clin Cases. Oct 16, 2022; 10(29): 10787-10793
Published online Oct 16, 2022. doi: 10.12998/wjcc.v10.i29.10787
Published online Oct 16, 2022. doi: 10.12998/wjcc.v10.i29.10787
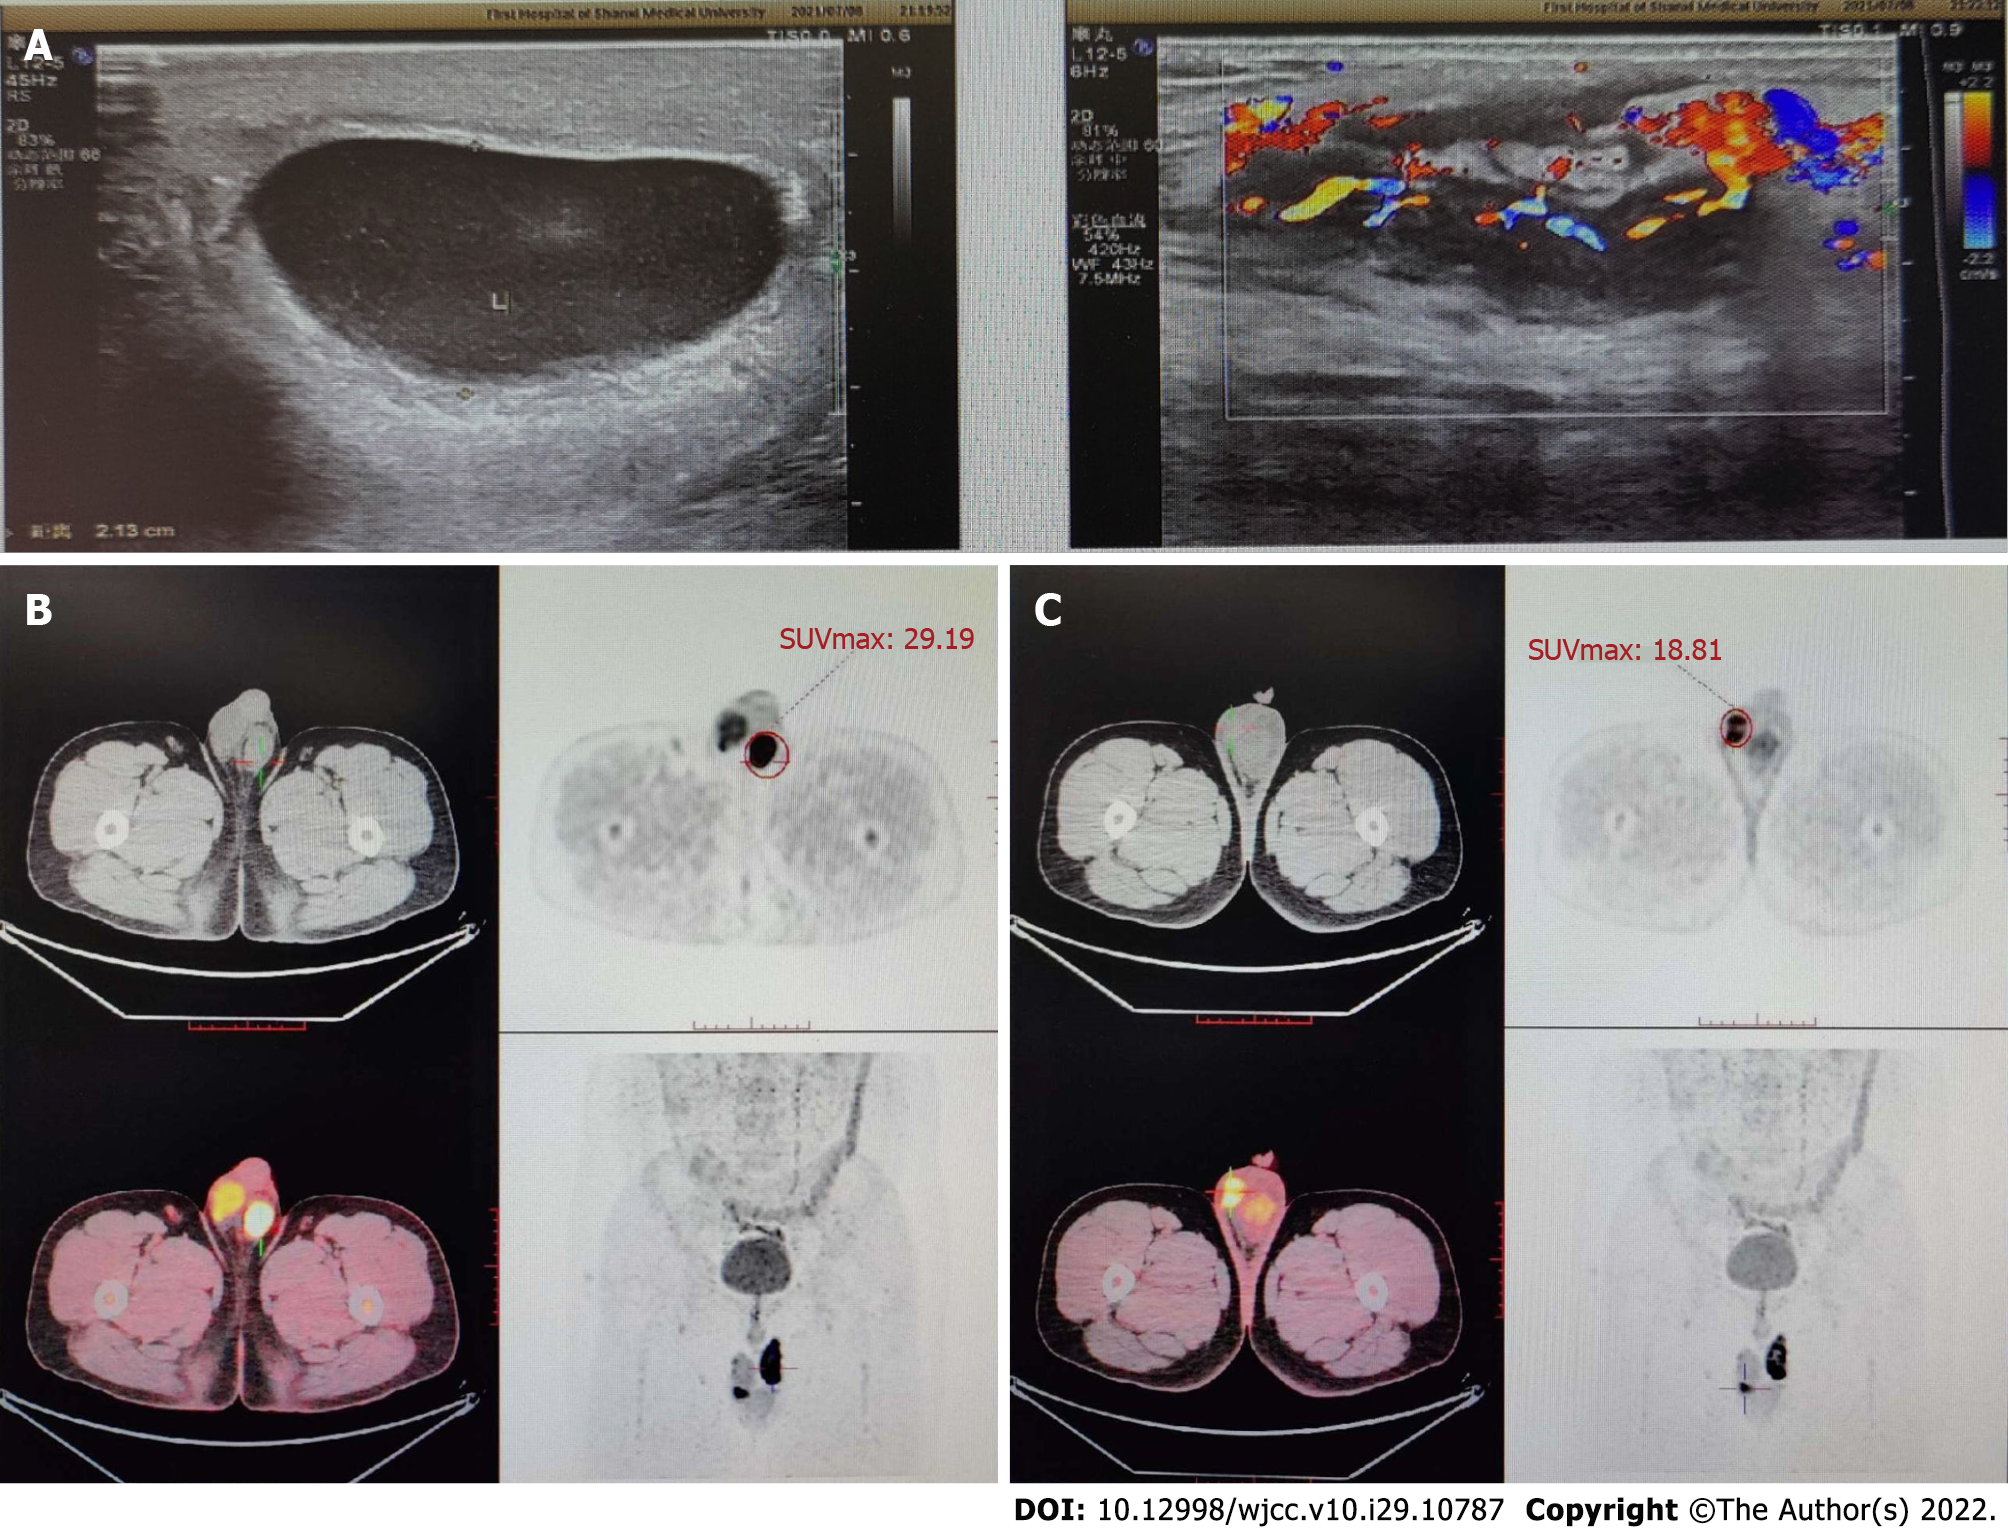
Figure 2 Imaging examinations.
A: Color Doppler ultrasound images of the scrotum. There were semi-swirl-like changes in the structure of the left spermatic cord and the echo decreased and was uneven; there was no obvious blood flow signal in the spermatic vein and the blood flow in the artery was filled well; B: Positron emission tomography, the metabolism of the soft tissue nodules of the spermatic vein in the left scrotum increased with a delayed maximum standardized uptake value (SUVmax) of 29.19; C: Computed tomography images of the scrotum, the focal metabolism in the right epididymis increased with a delayed SUVmax of 18.81.
- Citation: Lv DY, Xie HJ, Cui F, Zhou HY, Shuang WB. Bilateral occurrence of sperm granulomas in the left spermatic cord and on the right epididymis: A case report. World J Clin Cases 2022; 10(29): 10787-10793
- URL: https://www.wjgnet.com/2307-8960/full/v10/i29/10787.htm
- DOI: https://dx.doi.org/10.12998/wjcc.v10.i29.10787


