Copyright
©The Author(s) 2022.
World J Clin Cases. Oct 16, 2022; 10(29): 10565-10574
Published online Oct 16, 2022. doi: 10.12998/wjcc.v10.i29.10565
Published online Oct 16, 2022. doi: 10.12998/wjcc.v10.i29.10565
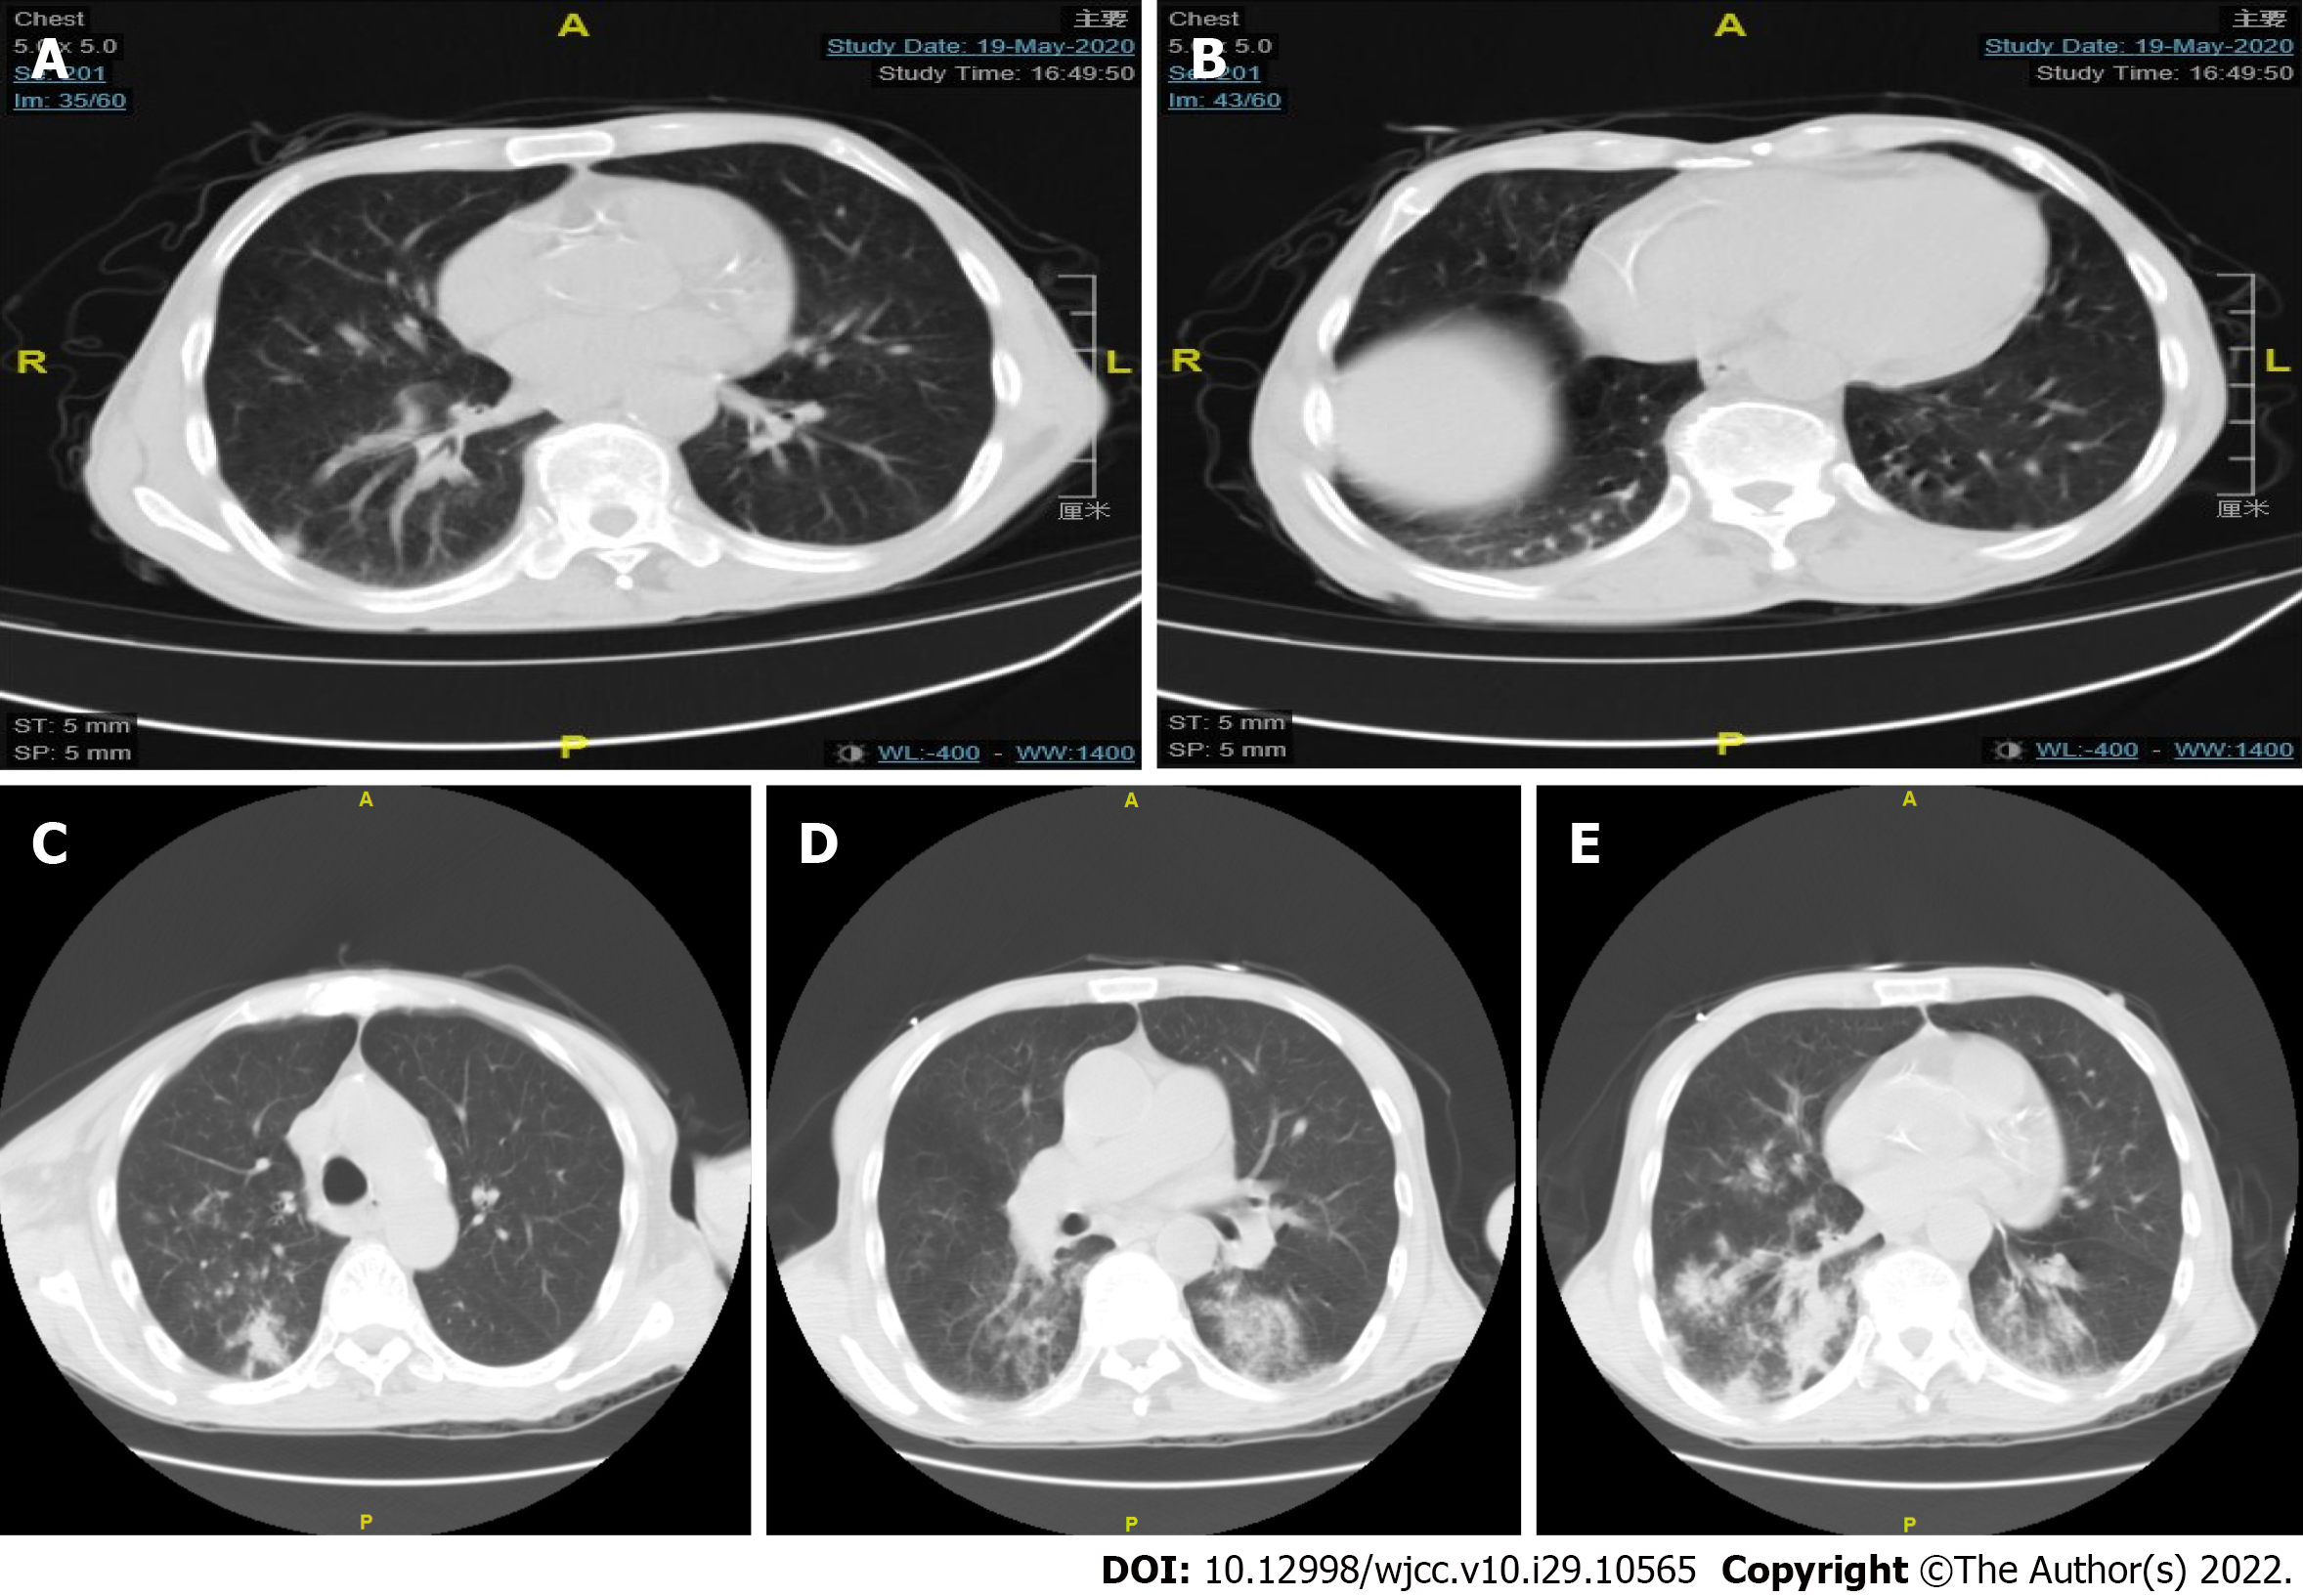
Figure 2 Chest computed tomography findings of the patient in two hospitalizations.
A and B: The patient's first chest computed tomography (CT) after the onset of illness. As shown by the arrows, a small amount of pleural effusion can be seen in both the lungs, and scattered nodules can be observed in the pleura and under the pleura; C-E: The results of chest CT upon two weeks later. The new appearances of the two lungs were mostly scattered in the patchy high-density shadows, with distinctly blurred boundaries, distributed along with the bronchial vascular bundle, mainly under the pleura.
- Citation: Wu GX, Zhou JY, Hong WJ, Huang J, Yan SQ. Treatment failure in a patient infected with Listeria sepsis combined with latent meningitis: A case report. World J Clin Cases 2022; 10(29): 10565-10574
- URL: https://www.wjgnet.com/2307-8960/full/v10/i29/10565.htm
- DOI: https://dx.doi.org/10.12998/wjcc.v10.i29.10565


