Copyright
©The Author(s) 2022.
World J Clin Cases. Sep 26, 2022; 10(27): 9768-9775
Published online Sep 26, 2022. doi: 10.12998/wjcc.v10.i27.9768
Published online Sep 26, 2022. doi: 10.12998/wjcc.v10.i27.9768
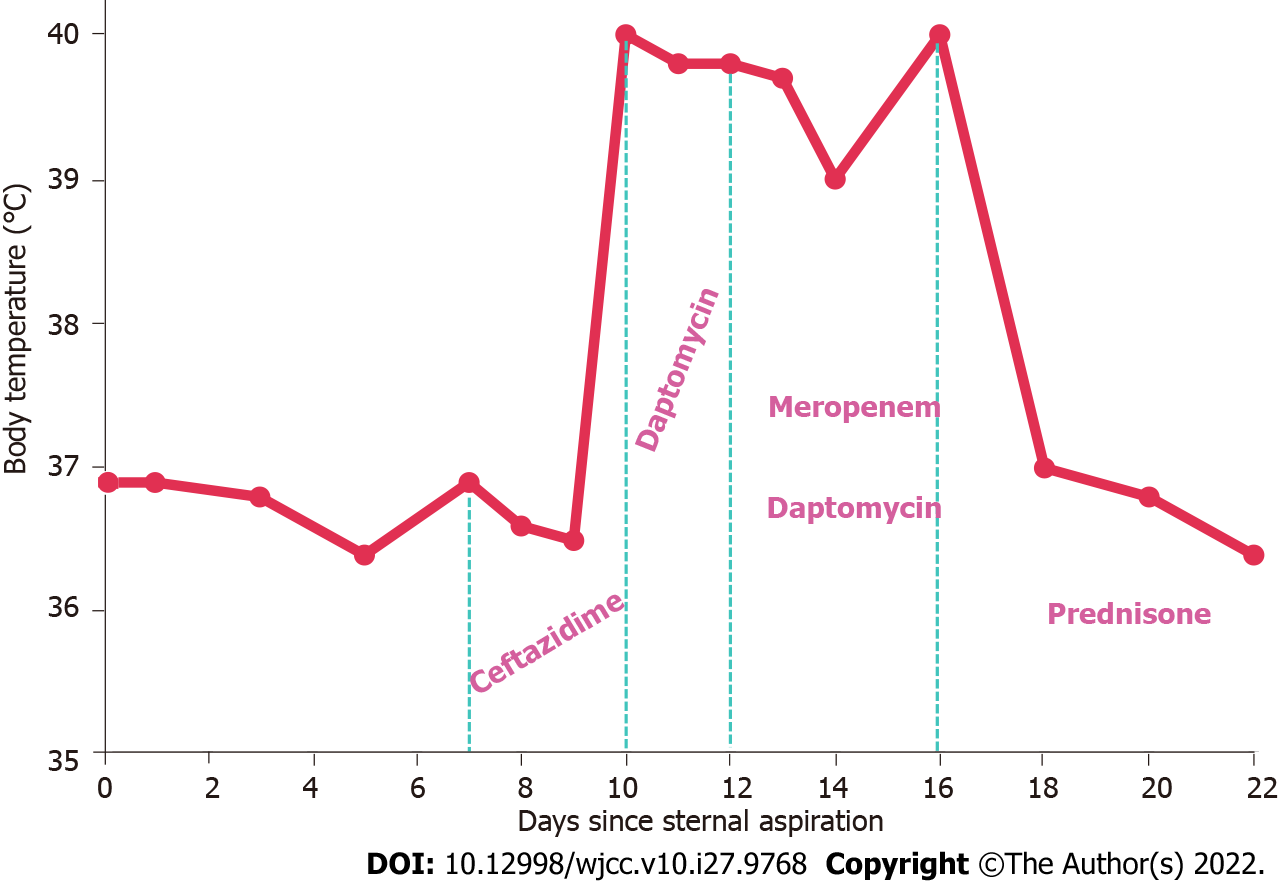
Figure 2 Body temperature chart and medication administration.
The x-axis represents the number of days since the sternal aspiration and the y-axis represents the body temperature. Between the light green dashed lines, the drugs used on the corresponding dates are listed.
- Citation: Zhao DW, Ni J, Sun XL. Histiocytoid giant cellulitis-like Sweet syndrome at the site of sternal aspiration: A case report and review of literature. World J Clin Cases 2022; 10(27): 9768-9775
- URL: https://www.wjgnet.com/2307-8960/full/v10/i27/9768.htm
- DOI: https://dx.doi.org/10.12998/wjcc.v10.i27.9768


